OPEN-SOURCE SCRIPT
Bias Ratio
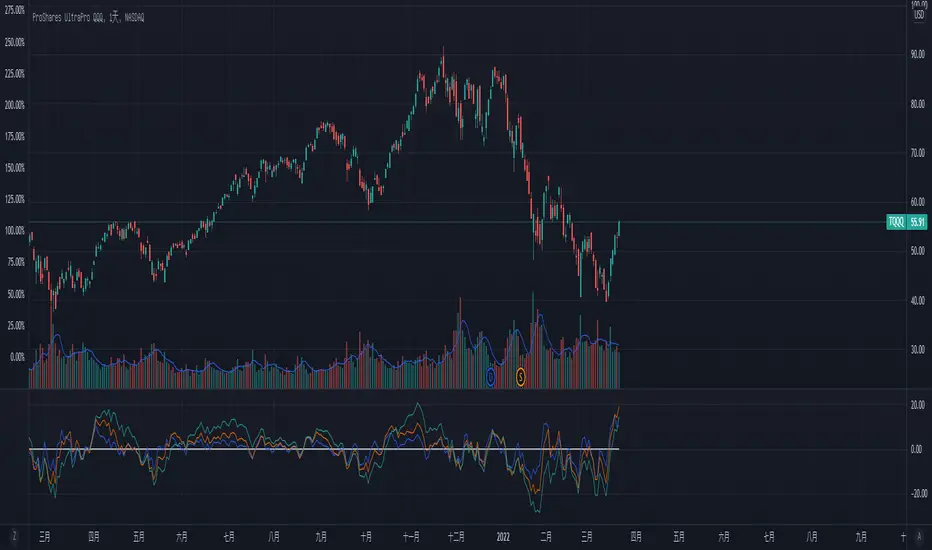
A simple indicator, but look like no one share, so I build it.
The description is copy from: baike.baidu.hk/item/乖�...
The bias ratio is an indicator used in finance to analyze the returns of investment portfolios, and in performing due diligence.
Eight key points:
1. The deviation rate approaches zero
When the deviation rate between the stock price per share and the average line reaches the maximum percentage, it will approach the zero value, or even be lower than or higher than zero, which is a normal phenomenon.
2. 30-day average deviation rate
When the deviation rate of the stock price and the 30-day average line exceeds +16%, it is an overbought phenomenon, which is the time to sell; when it reaches below -16%, it is an oversold phenomenon and it is a time to buy.
3. The deviation rate is high
Due to the influence of the fierce battle between long and short positions, individual stocks are prone to deviate from various averages, but the number of occurrences is not large.
4. Characteristics of positive and negative deviation rate
The deviation ratio can be divided into positive deviation ratio and negative deviation ratio. If the stock price is above the average line, it is positive deviation; if the stock price is below the average line, it is negative deviation; when the stock price intersects the average line, the deviation ratio is zero. The greater the positive divergence rate, the greater the short-term profit, the higher the possibility of profit taking; the greater the negative divergence rate, the higher the possibility of short covering.
5.10-day average deviation rate
When the deviation rate between the stock price and the 10-day average line exceeds +8%, it is an overbought phenomenon, which is the time to sell; when it reaches below -8%, it is an oversold phenomenon and it is a time to buy.
6. Application of negative deviation rate
In case of negative divergence in the rising market, you can buy at the falling price, because the risk of entering the market is small.
7. Positive deviation rate application
If there is a positive deviation in the general downward trend, you can hold it back and sell it at a high price.
8. Skyrocketing
A boom in a bull market and a plunge in a bear market can lead to divergences of unexpected percentages, but they occur very rarely and for a short period of time, and can be considered a special case.
오픈 소스 스크립트
트레이딩뷰의 진정한 정신에 따라, 이 스크립트의 작성자는 이를 오픈소스로 공개하여 트레이더들이 기능을 검토하고 검증할 수 있도록 했습니다. 작성자에게 찬사를 보냅니다! 이 코드는 무료로 사용할 수 있지만, 코드를 재게시하는 경우 하우스 룰이 적용된다는 점을 기억하세요.
면책사항
해당 정보와 게시물은 금융, 투자, 트레이딩 또는 기타 유형의 조언이나 권장 사항으로 간주되지 않으며, 트레이딩뷰에서 제공하거나 보증하는 것이 아닙니다. 자세한 내용은 이용 약관을 참조하세요.
오픈 소스 스크립트
트레이딩뷰의 진정한 정신에 따라, 이 스크립트의 작성자는 이를 오픈소스로 공개하여 트레이더들이 기능을 검토하고 검증할 수 있도록 했습니다. 작성자에게 찬사를 보냅니다! 이 코드는 무료로 사용할 수 있지만, 코드를 재게시하는 경우 하우스 룰이 적용된다는 점을 기억하세요.
면책사항
해당 정보와 게시물은 금융, 투자, 트레이딩 또는 기타 유형의 조언이나 권장 사항으로 간주되지 않으며, 트레이딩뷰에서 제공하거나 보증하는 것이 아닙니다. 자세한 내용은 이용 약관을 참조하세요.