OPEN-SOURCE SCRIPT
Loacally Weighted MA (LWMA) Direction Histogram
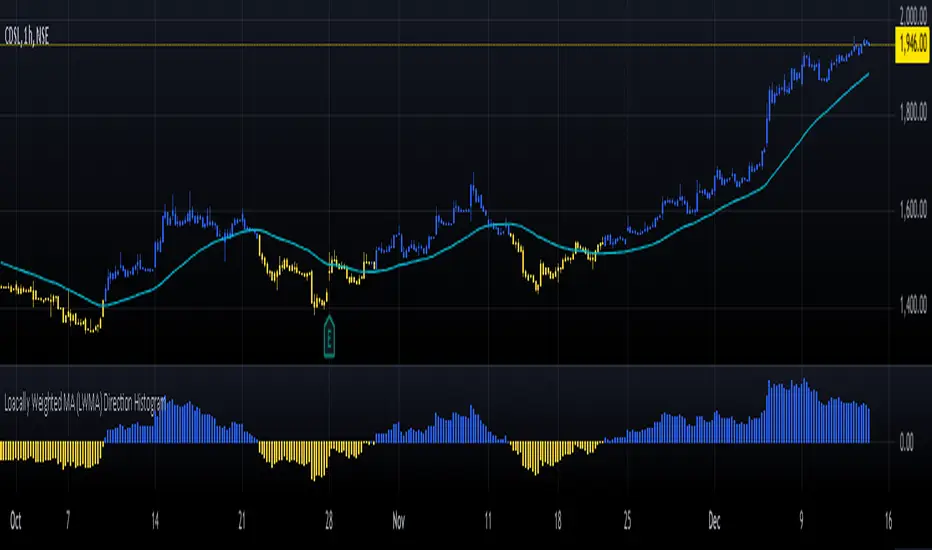
The Locally Weighted Moving Average (LWMA) Direction Histogram indicator is designed to provide traders with a visual representation of the price momentum and trend direction. This Pine Script, written in version 6, calculates an LWMA by assigning higher weights to recent data points, emphasizing the most current market movements. The script incorporates user-defined input parameters, such as the LWMA length and a direction lookback period, making it flexible to adapt to various trading strategies and preferences.
The histogram visually represents the difference between the current LWMA and a previous LWMA value (based on the lookback period). Positive values are colored blue, indicating upward momentum, while negative values are yellow, signaling downward movement. Additionally, the script colors candlesticks according to the histogram's value, enhancing clarity for users analyzing market trends. The LWMA line itself is plotted on the chart but hidden by default, enabling traders to toggle its visibility as needed. This blend of histogram and candlestick visualization offers a comprehensive tool for identifying shifts in momentum and potential trading opportunities.
The histogram visually represents the difference between the current LWMA and a previous LWMA value (based on the lookback period). Positive values are colored blue, indicating upward momentum, while negative values are yellow, signaling downward movement. Additionally, the script colors candlesticks according to the histogram's value, enhancing clarity for users analyzing market trends. The LWMA line itself is plotted on the chart but hidden by default, enabling traders to toggle its visibility as needed. This blend of histogram and candlestick visualization offers a comprehensive tool for identifying shifts in momentum and potential trading opportunities.
오픈 소스 스크립트
트레이딩뷰의 진정한 정신에 따라, 이 스크립트의 작성자는 이를 오픈소스로 공개하여 트레이더들이 기능을 검토하고 검증할 수 있도록 했습니다. 작성자에게 찬사를 보냅니다! 이 코드는 무료로 사용할 수 있지만, 코드를 재게시하는 경우 하우스 룰이 적용된다는 점을 기억하세요.
면책사항
해당 정보와 게시물은 금융, 투자, 트레이딩 또는 기타 유형의 조언이나 권장 사항으로 간주되지 않으며, 트레이딩뷰에서 제공하거나 보증하는 것이 아닙니다. 자세한 내용은 이용 약관을 참조하세요.
오픈 소스 스크립트
트레이딩뷰의 진정한 정신에 따라, 이 스크립트의 작성자는 이를 오픈소스로 공개하여 트레이더들이 기능을 검토하고 검증할 수 있도록 했습니다. 작성자에게 찬사를 보냅니다! 이 코드는 무료로 사용할 수 있지만, 코드를 재게시하는 경우 하우스 룰이 적용된다는 점을 기억하세요.
면책사항
해당 정보와 게시물은 금융, 투자, 트레이딩 또는 기타 유형의 조언이나 권장 사항으로 간주되지 않으며, 트레이딩뷰에서 제공하거나 보증하는 것이 아닙니다. 자세한 내용은 이용 약관을 참조하세요.