OPEN-SOURCE SCRIPT
업데이트됨 Logarithmic Volume
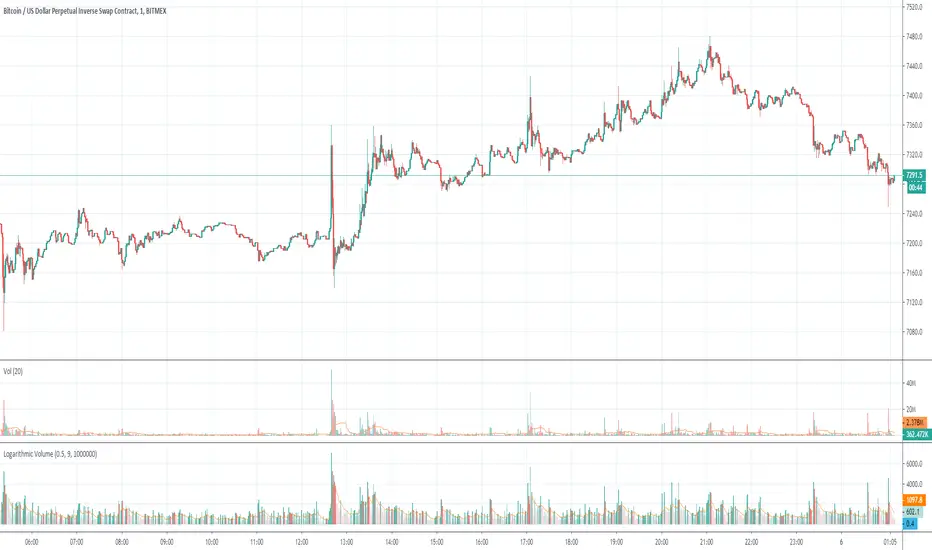
In volatile markets, normal indicator suffer from volume spikes that make the rest of plot seem non-existent.
Using logarithmic exponent, this indicator normalizes the volume, so this makes it easier to read.
The obvious drawback is that it does not display the actual volume amount, only a relative value.
Using logarithmic exponent, this indicator normalizes the volume, so this makes it easier to read.
The obvious drawback is that it does not display the actual volume amount, only a relative value.
릴리즈 노트
Included the original volume indicator in the screenshot so you can see the difference.릴리즈 노트
Fixed incorrect bar colors, note: it's actually intended to be green on rising volume and red on declining volume.릴리즈 노트
I found the way to include the original volume data on the chart!The actual volume is being divided by a large number, so it doesn't break the chart.
The outcome value is small and transparent, yet it's still printed on the chart.
In this example it is divided by 1000000 or one million bitmex contracts.
오픈 소스 스크립트
트레이딩뷰의 진정한 정신에 따라, 이 스크립트의 작성자는 이를 오픈소스로 공개하여 트레이더들이 기능을 검토하고 검증할 수 있도록 했습니다. 작성자에게 찬사를 보냅니다! 이 코드는 무료로 사용할 수 있지만, 코드를 재게시하는 경우 하우스 룰이 적용된다는 점을 기억하세요.
면책사항
해당 정보와 게시물은 금융, 투자, 트레이딩 또는 기타 유형의 조언이나 권장 사항으로 간주되지 않으며, 트레이딩뷰에서 제공하거나 보증하는 것이 아닙니다. 자세한 내용은 이용 약관을 참조하세요.
오픈 소스 스크립트
트레이딩뷰의 진정한 정신에 따라, 이 스크립트의 작성자는 이를 오픈소스로 공개하여 트레이더들이 기능을 검토하고 검증할 수 있도록 했습니다. 작성자에게 찬사를 보냅니다! 이 코드는 무료로 사용할 수 있지만, 코드를 재게시하는 경우 하우스 룰이 적용된다는 점을 기억하세요.
면책사항
해당 정보와 게시물은 금융, 투자, 트레이딩 또는 기타 유형의 조언이나 권장 사항으로 간주되지 않으며, 트레이딩뷰에서 제공하거나 보증하는 것이 아닙니다. 자세한 내용은 이용 약관을 참조하세요.