OPEN-SOURCE SCRIPT
Rolling VWAP Channel [LuxAlgo]
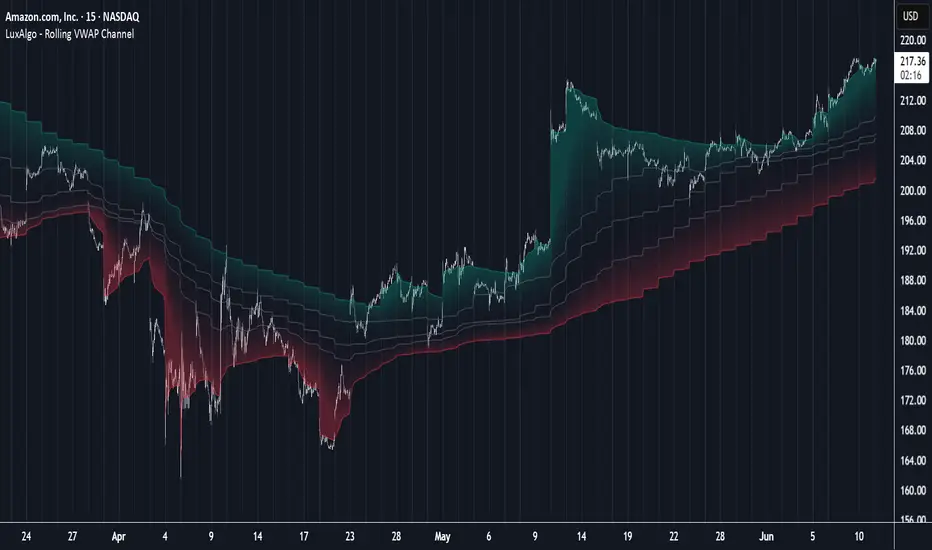
The Rolling VWAP Channel indicator creates a channel by analyzing a large number of Volume Weighted Average Prices (VWAPs) and determining a Channel based on percentile linear interpolation throughout the VWAPs.
🔶 USAGE

In this indicator, we have formed a Channel by first calculating multiple VWAPs, each with their respective anchor, then locating prices using "Percentile Linear Interpolation".
Note: Percentile Linear Interpolation locates the price point at which a specified percentage of VWAPs fall below it.
For example, a percentile of 50% would mean that 50% of the VWAP values fall below this price.
This method of analysis is important since the VWAPs are not often evenly distributed; therefore, we are able to draw importance to different levels by analyzing in percentiles.
When visualized, there is typically clustering of the VWAP values, which occurs at any given time, as seen below.

The channel can be tailored to each individual, with full control of each percentile represented in the channel. That being said, a general concept is that these clustered areas are clear results of sideways price action, which would lead us to believe that after interactions at these levels, we should expect to see a directional decision made by the market closely after.
🔶 DETAILS
The Rolling VWAP calculation calculates a user-specified number of VWAPs (up to 500), each anchored to a unique starting point in the chart based on the start of a new timeframe.
Each new timeframe that occurs causes a new VWAP to initialize. When the total number of desired VWAPs is reached, the oldest VWAP is removed and re-initialized, anchored to the current bar. Hence, the name "Rolling" VWAPs
This method allows us to automatically generate and manage large amounts of VWAPs without the need for user interaction.
After we have generated these VWAPs, we are able to run analyses on their returned values, such as the "Percentile Linear Interpolation" mentioned in the section above.
🔶 SETTINGS
🔹 Channel Lines
🔹 Calculation
🔶 USAGE
In this indicator, we have formed a Channel by first calculating multiple VWAPs, each with their respective anchor, then locating prices using "Percentile Linear Interpolation".
Note: Percentile Linear Interpolation locates the price point at which a specified percentage of VWAPs fall below it.
For example, a percentile of 50% would mean that 50% of the VWAP values fall below this price.
This method of analysis is important since the VWAPs are not often evenly distributed; therefore, we are able to draw importance to different levels by analyzing in percentiles.
When visualized, there is typically clustering of the VWAP values, which occurs at any given time, as seen below.
The channel can be tailored to each individual, with full control of each percentile represented in the channel. That being said, a general concept is that these clustered areas are clear results of sideways price action, which would lead us to believe that after interactions at these levels, we should expect to see a directional decision made by the market closely after.
🔶 DETAILS
The Rolling VWAP calculation calculates a user-specified number of VWAPs (up to 500), each anchored to a unique starting point in the chart based on the start of a new timeframe.
Each new timeframe that occurs causes a new VWAP to initialize. When the total number of desired VWAPs is reached, the oldest VWAP is removed and re-initialized, anchored to the current bar. Hence, the name "Rolling" VWAPs
This method allows us to automatically generate and manage large amounts of VWAPs without the need for user interaction.
After we have generated these VWAPs, we are able to run analyses on their returned values, such as the "Percentile Linear Interpolation" mentioned in the section above.
🔶 SETTINGS
- Anchor Period: Choose which time period to use as the anchor point to initialize new VWAPs from.
- VWAP Source: Choose the source for your VWAPs to calculate.
- VWAP Amount: Sets the number of VWAPs to use. After this amount is on the chart, the oldest will be rolled.
🔹 Channel Lines
- Toggle: Enable the associated VWAP Channel percentile line.
- Percentile: Adjust each line's percentile independently for your needs.
- Width: Adjust the width of the associated percentile line.
🔹 Calculation
- Calculated Bars: Tells the indicator how many bars to calculate on, for faster calculations with less history, use a lower value. Setting this to 0 will remove the bar constraint.
오픈 소스 스크립트
트레이딩뷰의 진정한 정신에 따라, 이 스크립트의 작성자는 이를 오픈소스로 공개하여 트레이더들이 기능을 검토하고 검증할 수 있도록 했습니다. 작성자에게 찬사를 보냅니다! 이 코드는 무료로 사용할 수 있지만, 코드를 재게시하는 경우 하우스 룰이 적용된다는 점을 기억하세요.
Get exclusive indicators & AI trading strategies: luxalgo.com
Free 150k+ community: discord.gg/lux
All content provided by LuxAlgo is for informational & educational purposes only. Past performance does not guarantee future results.
Free 150k+ community: discord.gg/lux
All content provided by LuxAlgo is for informational & educational purposes only. Past performance does not guarantee future results.
면책사항
해당 정보와 게시물은 금융, 투자, 트레이딩 또는 기타 유형의 조언이나 권장 사항으로 간주되지 않으며, 트레이딩뷰에서 제공하거나 보증하는 것이 아닙니다. 자세한 내용은 이용 약관을 참조하세요.