PROTECTED SOURCE SCRIPT
업데이트됨 NQ Hourly Stats - Detailed Prob (24h)
Hourly Sweep Statistics - Probability Engine (Credits to nqstats.com/)
Overview
This indicator is a powerful statistical tool designed for intraday traders, particularly those focused on session-based patterns and mean reversion strategies. It automatically tracks the previous hour's high, low, and open, and when a sweep of the high or low occurs, it instantly displays the historical probability of the price returning to the hourly open within that same hour.
The core of this indicator is a comprehensive probability model built on historical price data, providing traders with an objective, data-driven edge.
Key Concepts
The indicator operates on a simple but effective premise: after the high or low of the previous hour is taken, what is the statistical likelihood that price will revert back to the opening price of the current hour?
• Previous Hour High (PHH) & Previous Hour Low (PHL): These levels often act as key liquidity zones. A sweep of these levels can signify either a stop run before a reversal or the start of a strong continuation.
• Return to Open: This is a classic mean-reversion concept. The indicator quantifies the probability of this event happening based on the exact time the sweep occurs.
• Time-Based Probability: The probability of returning to the open is not static; it changes depending on when the sweep happens. A sweep in the first 5 minutes of the hour has a different statistical outcome than a sweep in the last 5 minutes. This indicator accounts for that variance by breaking down the hour into 12 distinct 5-minute buckets.
How It Works
1. Automatic Level Plotting: At the start of each new hour, the indicator automatically draws three lines on your chart:
o The Previous Hour's High (Teal, solid line)
o The Previous Hour's Low (Maroon, solid line)
o The Current Hour's Open (Gray, dotted line)
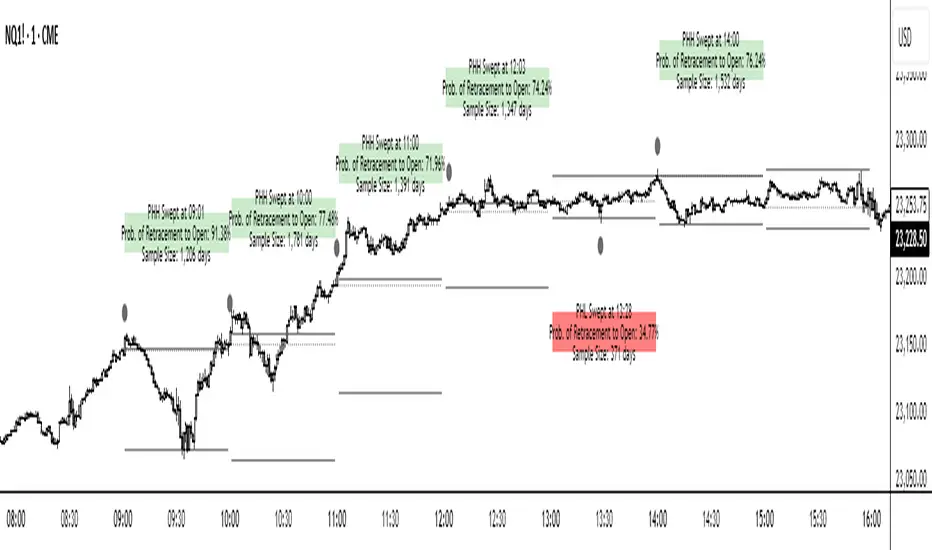
2. Sweep Detection & Labeling: The script constantly monitors price action. The moment the current price action sweeps (touches or breaks) the PHH or PHL, a label appears.
o High Sweep: A label will appear above the PHH line.
o Low Sweep: A label will appear below the PHL line.
3. Information-Rich Labels: Each label provides crucial, real-time information:
o Direction: "Took PHH" or "Took PHL".
o Time: The exact time (@ HH:MM) the sweep occurred.
o Probability: The historical probability ("Prob to Open: XX.XX%") of price returning to the hourly open after that specific sweep.
4. Dynamic Color-Coding: The labels are color-coded for at-a-glance interpretation:
o Green: High probability (>70%) - Strong statistical likelihood of returning to the open.
o Orange: Medium probability (40%-70%) - Neutral/moderate likelihood.
o Red: Low probability (<40%) - Weak statistical likelihood of returning to the open; may suggest trend continuation.
How to Use in Your Trading
This indicator is not a standalone signal generator but a powerful confluence tool to enhance your decision-making.
• Mean Reversion Setups: When a sweep occurs and a high-probability (green) label appears, it can serve as strong confirmation for a mean-reversion trade. You can look for entries on a lower timeframe, targeting the hourly open.
• Trend Continuation Setups: If a sweep generates a low-probability (red) label, it suggests that the move has strength and is less likely to reverse. This can be used to validate a breakout or trend-following strategy, or to avoid taking a counter-trend trade.
• Filtering Trades: Use the probabilities to filter your existing setups. You might choose to only take reversion trades when the probability is above a certain threshold (e.g., 70%) or avoid them entirely when the probability is low.
Features & Customization
• Full 24-Hour Data: The statistical model includes data for all 24 hours of the day, making it useful for trading any session (Asia, London, New York).
• Timezone Setting: Ensure you set the Chart Timezone input to match your chart's timezone (e.g., 'America/New_York') for the probabilities to be accurate.
• Custom Colors: All line colors are fully customizable to match your chart's theme.
Disclaimer: This indicator is based on historical statistics and does not guarantee future results. It should be used as part of a comprehensive trading plan that includes proper risk management. Always do your own research and backtesting.
Overview
This indicator is a powerful statistical tool designed for intraday traders, particularly those focused on session-based patterns and mean reversion strategies. It automatically tracks the previous hour's high, low, and open, and when a sweep of the high or low occurs, it instantly displays the historical probability of the price returning to the hourly open within that same hour.
The core of this indicator is a comprehensive probability model built on historical price data, providing traders with an objective, data-driven edge.
Key Concepts
The indicator operates on a simple but effective premise: after the high or low of the previous hour is taken, what is the statistical likelihood that price will revert back to the opening price of the current hour?
• Previous Hour High (PHH) & Previous Hour Low (PHL): These levels often act as key liquidity zones. A sweep of these levels can signify either a stop run before a reversal or the start of a strong continuation.
• Return to Open: This is a classic mean-reversion concept. The indicator quantifies the probability of this event happening based on the exact time the sweep occurs.
• Time-Based Probability: The probability of returning to the open is not static; it changes depending on when the sweep happens. A sweep in the first 5 minutes of the hour has a different statistical outcome than a sweep in the last 5 minutes. This indicator accounts for that variance by breaking down the hour into 12 distinct 5-minute buckets.
How It Works
1. Automatic Level Plotting: At the start of each new hour, the indicator automatically draws three lines on your chart:
o The Previous Hour's High (Teal, solid line)
o The Previous Hour's Low (Maroon, solid line)
o The Current Hour's Open (Gray, dotted line)
2. Sweep Detection & Labeling: The script constantly monitors price action. The moment the current price action sweeps (touches or breaks) the PHH or PHL, a label appears.
o High Sweep: A label will appear above the PHH line.
o Low Sweep: A label will appear below the PHL line.
3. Information-Rich Labels: Each label provides crucial, real-time information:
o Direction: "Took PHH" or "Took PHL".
o Time: The exact time (@ HH:MM) the sweep occurred.
o Probability: The historical probability ("Prob to Open: XX.XX%") of price returning to the hourly open after that specific sweep.
4. Dynamic Color-Coding: The labels are color-coded for at-a-glance interpretation:
o Green: High probability (>70%) - Strong statistical likelihood of returning to the open.
o Orange: Medium probability (40%-70%) - Neutral/moderate likelihood.
o Red: Low probability (<40%) - Weak statistical likelihood of returning to the open; may suggest trend continuation.
How to Use in Your Trading
This indicator is not a standalone signal generator but a powerful confluence tool to enhance your decision-making.
• Mean Reversion Setups: When a sweep occurs and a high-probability (green) label appears, it can serve as strong confirmation for a mean-reversion trade. You can look for entries on a lower timeframe, targeting the hourly open.
• Trend Continuation Setups: If a sweep generates a low-probability (red) label, it suggests that the move has strength and is less likely to reverse. This can be used to validate a breakout or trend-following strategy, or to avoid taking a counter-trend trade.
• Filtering Trades: Use the probabilities to filter your existing setups. You might choose to only take reversion trades when the probability is above a certain threshold (e.g., 70%) or avoid them entirely when the probability is low.
Features & Customization
• Full 24-Hour Data: The statistical model includes data for all 24 hours of the day, making it useful for trading any session (Asia, London, New York).
• Timezone Setting: Ensure you set the Chart Timezone input to match your chart's timezone (e.g., 'America/New_York') for the probabilities to be accurate.
• Custom Colors: All line colors are fully customizable to match your chart's theme.
Disclaimer: This indicator is based on historical statistics and does not guarantee future results. It should be used as part of a comprehensive trading plan that includes proper risk management. Always do your own research and backtesting.
릴리즈 노트
replaced labels with box info릴리즈 노트
custom box colors릴리즈 노트
customizable lines릴리즈 노트
added shape plotting for PHL/PHH sweep candles릴리즈 노트
minor bug fix릴리즈 노트
added label texts릴리즈 노트
/릴리즈 노트
fix/릴리즈 노트
bug fix.릴리즈 노트
/릴리즈 노트
/릴리즈 노트
..릴리즈 노트
alerts added.릴리즈 노트
updated details릴리즈 노트
/릴리즈 노트
Indicator was sending invalid alarms at the hourly candle openings. Fixed it.릴리즈 노트
Updated Probability Values according to latest dataset.릴리즈 노트
Added different timeframe statistics. Enjoy보호된 스크립트입니다
이 스크립트는 비공개 소스로 게시됩니다. 하지만 이를 자유롭게 제한 없이 사용할 수 있습니다 – 자세한 내용은 여기에서 확인하세요.
면책사항
해당 정보와 게시물은 금융, 투자, 트레이딩 또는 기타 유형의 조언이나 권장 사항으로 간주되지 않으며, 트레이딩뷰에서 제공하거나 보증하는 것이 아닙니다. 자세한 내용은 이용 약관을 참조하세요.
면책사항
해당 정보와 게시물은 금융, 투자, 트레이딩 또는 기타 유형의 조언이나 권장 사항으로 간주되지 않으며, 트레이딩뷰에서 제공하거나 보증하는 것이 아닙니다. 자세한 내용은 이용 약관을 참조하세요.