INVITE-ONLY SCRIPT
업데이트됨 Smart Sizing
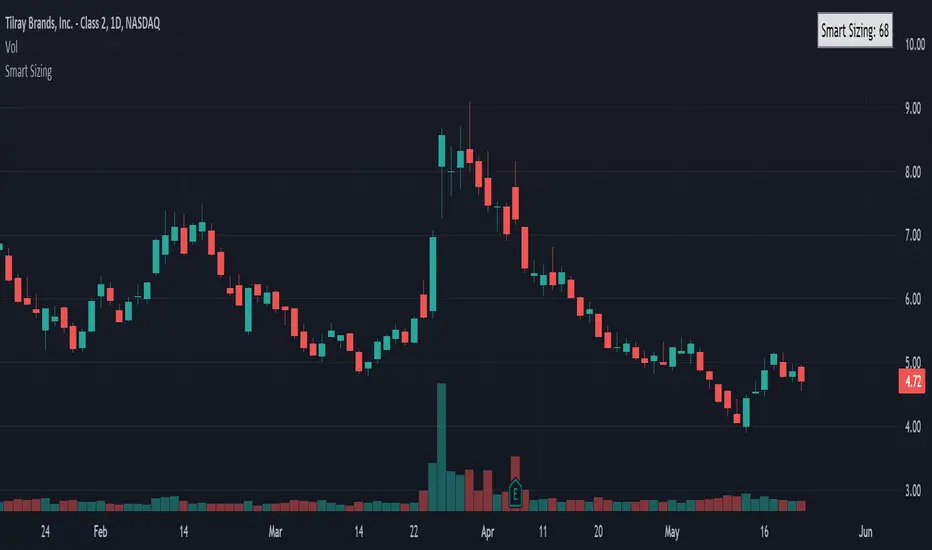
Smart Sizing is a simple indicator designed for stock traders to quickly see how many shares you should ideally trade to have an equal amount of risk on all of your trades. It uses your inputted values along with the ATR to determine the right amount of shares you should trade. Since every stock has a different level of volatility just simply buying 100 shares for every trade for example or an equal $ amount like $10,000 will leave your portfolio with concentrated risk in some stocks. If the more volatile stocks turn out to be losers then the wins from the less volatile stocks may not cover the losses, however if your positions were sized according to the volatility of each stock it may have resulted in being profitable overall instead.
That's what the Smart Sizing indicator does, it tells you directly on the chart in a small table and right next to the indicator a value that is how many shares to trade according to your account value and risk objectives. You simply enter in your account value in the indicator settings (I update mine everyday), what % of your account you want to risk, and what ATR Length and Timeframe you wish to use. For example, if you entered your account value at $10,000 with risk percentage at 1% and if you used the daily ATR which was 0.50 then it would show as 200 shares (10,000 x 0.01) / 0.50 = 200 and by trading 200 shares that means if the stock went against you by 1 daily ATR it would equal 1% of your account. So if you used a ATR trailing stop or a fixed stop based on the ATR this indicator can help you determine what your correct position size should be so you can practice good risk management.
Take the example below of two stocks with an almost identical price, Citigroup $C with a last traded price of $50.03 and Exelon EXC with a last traded price of $50.02, you can see the Smart Sizing indicator is showing to trade 59 shares on Citigroup and 130 shares on Exelon, even though both stocks have almost the same stock price the different recommended position size is because Citigroup is much more volatile than Exelon which is a electric utility.


Please note this indicator is designed for stocks but could also be used for forex but shouldn't be used for futures. It can be used on any timeframe with stocks worldwide.
Jared.
Disclaimer: All my scripts and content are for educational purposes only. I'm not a financial advisor and do not give personal finance advice. Past performance is no guarantee of future performance. Please trade at your own risk.
That's what the Smart Sizing indicator does, it tells you directly on the chart in a small table and right next to the indicator a value that is how many shares to trade according to your account value and risk objectives. You simply enter in your account value in the indicator settings (I update mine everyday), what % of your account you want to risk, and what ATR Length and Timeframe you wish to use. For example, if you entered your account value at $10,000 with risk percentage at 1% and if you used the daily ATR which was 0.50 then it would show as 200 shares (10,000 x 0.01) / 0.50 = 200 and by trading 200 shares that means if the stock went against you by 1 daily ATR it would equal 1% of your account. So if you used a ATR trailing stop or a fixed stop based on the ATR this indicator can help you determine what your correct position size should be so you can practice good risk management.
Take the example below of two stocks with an almost identical price, Citigroup $C with a last traded price of $50.03 and Exelon
Please note this indicator is designed for stocks but could also be used for forex but shouldn't be used for futures. It can be used on any timeframe with stocks worldwide.
Jared.
Disclaimer: All my scripts and content are for educational purposes only. I'm not a financial advisor and do not give personal finance advice. Past performance is no guarantee of future performance. Please trade at your own risk.
릴리즈 노트
Updated default risk percentage and lookback settings along with new wording.초대 전용 스크립트
이 스크립트는 작성자가 승인한 사용자만 접근할 수 있습니다. 사용하려면 요청 후 승인을 받아야 하며, 일반적으로 결제 후에 허가가 부여됩니다. 자세한 내용은 아래 작성자의 안내를 따르거나 Click-Capital에게 직접 문의하세요.
트레이딩뷰는 스크립트의 작동 방식을 충분히 이해하고 작성자를 완전히 신뢰하지 않는 이상, 해당 스크립트에 비용을 지불하거나 사용하는 것을 권장하지 않습니다. 커뮤니티 스크립트에서 무료 오픈소스 대안을 찾아보실 수도 있습니다.
작성자 지시 사항
Contact me using TradingView private chat to request access to my invite-only scripts.
면책사항
해당 정보와 게시물은 금융, 투자, 트레이딩 또는 기타 유형의 조언이나 권장 사항으로 간주되지 않으며, 트레이딩뷰에서 제공하거나 보증하는 것이 아닙니다. 자세한 내용은 이용 약관을 참조하세요.
초대 전용 스크립트
이 스크립트는 작성자가 승인한 사용자만 접근할 수 있습니다. 사용하려면 요청 후 승인을 받아야 하며, 일반적으로 결제 후에 허가가 부여됩니다. 자세한 내용은 아래 작성자의 안내를 따르거나 Click-Capital에게 직접 문의하세요.
트레이딩뷰는 스크립트의 작동 방식을 충분히 이해하고 작성자를 완전히 신뢰하지 않는 이상, 해당 스크립트에 비용을 지불하거나 사용하는 것을 권장하지 않습니다. 커뮤니티 스크립트에서 무료 오픈소스 대안을 찾아보실 수도 있습니다.
작성자 지시 사항
Contact me using TradingView private chat to request access to my invite-only scripts.
면책사항
해당 정보와 게시물은 금융, 투자, 트레이딩 또는 기타 유형의 조언이나 권장 사항으로 간주되지 않으며, 트레이딩뷰에서 제공하거나 보증하는 것이 아닙니다. 자세한 내용은 이용 약관을 참조하세요.