PROTECTED SOURCE SCRIPT
Fetch Trends
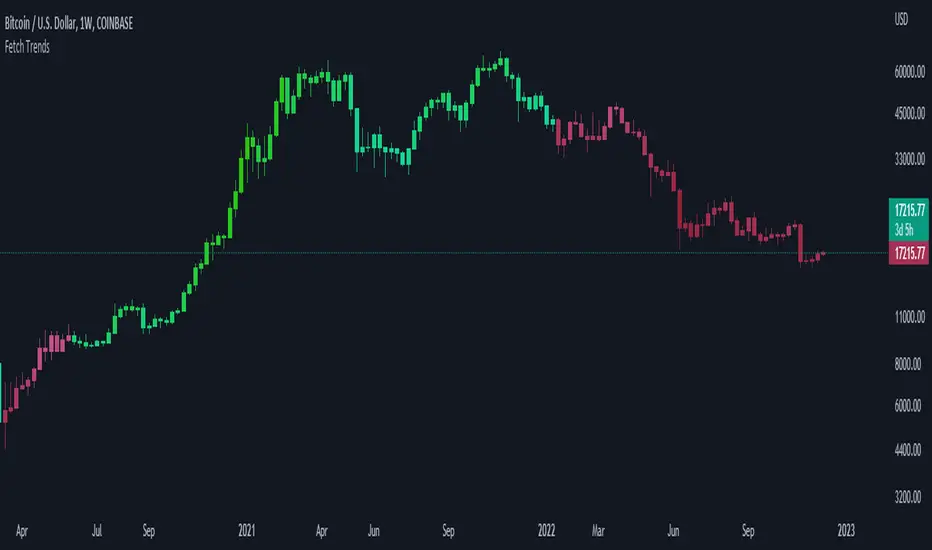
This indicator can be used as a tool to measure the strength of the current trend. It is also trying to achieve to alert traders on when a trend can shift.
In order to achieve this, it uses three simple indicators:
1: 9 Simple moving average
2: 50 Simple moving average
3: Rsi (14)
The moving averages are used to define the current trend of the market, and the rsi is used to measure the strength. We use a color gradient to reach our second goal with this indicator.
The gradient is calculated based on the rsi value, which means the trader can use this indicator to visualize the strength of the current trend. It also helps to alert the trader when the trend starts to shift.
Lets say we use green to signal a strong positive trend, and blue for a weak positive trend. The candles are green in a strong uptrend, and are getting more blue once the trend starts to weaken.
As soon as the trend shifts from bullish to bearish, the bars become a diferent color.
보호된 스크립트입니다
이 스크립트는 비공개 소스로 게시됩니다. 하지만 이를 자유롭게 제한 없이 사용할 수 있습니다 – 자세한 내용은 여기에서 확인하세요.
면책사항
해당 정보와 게시물은 금융, 투자, 트레이딩 또는 기타 유형의 조언이나 권장 사항으로 간주되지 않으며, 트레이딩뷰에서 제공하거나 보증하는 것이 아닙니다. 자세한 내용은 이용 약관을 참조하세요.
면책사항
해당 정보와 게시물은 금융, 투자, 트레이딩 또는 기타 유형의 조언이나 권장 사항으로 간주되지 않으며, 트레이딩뷰에서 제공하거나 보증하는 것이 아닙니다. 자세한 내용은 이용 약관을 참조하세요.