OPEN-SOURCE SCRIPT
PHD-Points
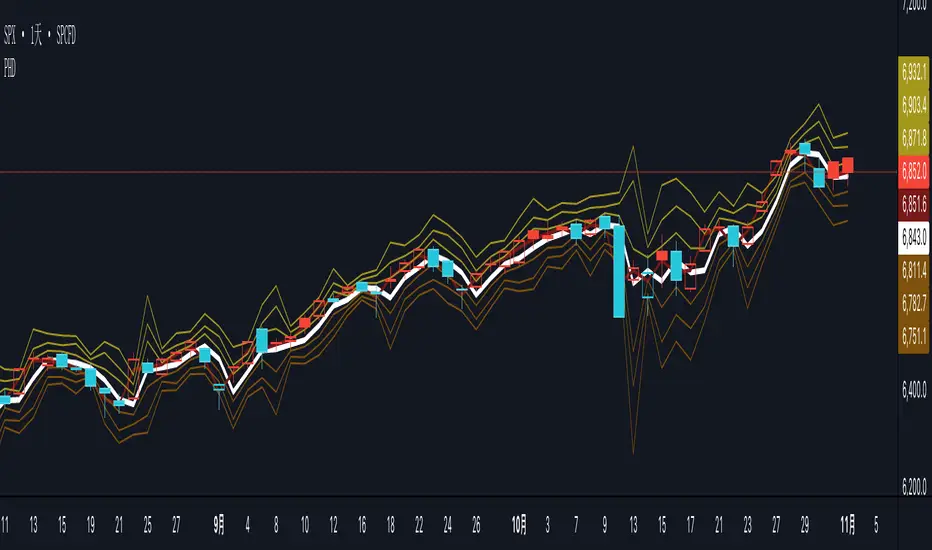
The PHD Pivot Points indicator is a professional-grade support and resistance tool that calculates key price levels based on previous day's price action and current intraday data. It provides traders with multiple reference points for identifying potential reversal zones, breakout levels, and strategic entry/exit positions.
Key Components
1. Previous Day Pivot Point (P)
White Line - The main pivot level calculated from previous day's High, Low, and Close
Formula: P = (Previous High + Previous Low + Previous Close) / 3
Serves as the central reference point for the trading day
Often acts as a psychological support/resistance level
2. Previous Day Support Levels (D1, D2, D3)
Brown Lines - Three support levels below the previous day's pivot
D1 (Support 1): First support level, closest to pivot
D2 (Support 2): Second support level, medium-strength
D3 (Support 3): Third support level, strongest support
Calculated using previous day's high and low ranges
3. Previous Day Resistance Levels (H1, H2, H3)
Yellow-Brown Lines - Three resistance levels above the previous day's pivot
H1 (Resistance 1): First resistance level, closest to pivot
H2 (Resistance 2): Second resistance level, medium-strength
H3 (Resistance 3): Third resistance level, strongest resistance
Calculated using previous day's high and low ranges
4. Today's Pivot Point (PT)
Dark Red Line - Dynamic pivot point that updates throughout the current trading session
Formula: PT = (Current High + Current Low + Current Close) / 3
Provides real-time trend reference for intraday trading
Helps identify intraday momentum and trend strength
5. Today's Dynamic Levels (DD1-DD3, HH1-HH3)
Calculated but not plotted by default
These values represent current session's support and resistance levels
Can be used for advanced intraday analysis
Trading Applications
Support and Resistance Trading
Price tends to bounce at D1, D2, D3 levels (potential buy zones)
Price tends to stall or reverse at H1, H2, H3 levels (potential sell zones)
Breaks above/below these levels signal trend strength
Trend Identification
Price above P = Bullish bias
Price below P = Bearish bias
PT line angle shows intraday momentum direction
오픈 소스 스크립트
트레이딩뷰의 진정한 정신에 따라, 이 스크립트의 작성자는 이를 오픈소스로 공개하여 트레이더들이 기능을 검토하고 검증할 수 있도록 했습니다. 작성자에게 찬사를 보냅니다! 이 코드는 무료로 사용할 수 있지만, 코드를 재게시하는 경우 하우스 룰이 적용된다는 점을 기억하세요.
면책사항
해당 정보와 게시물은 금융, 투자, 트레이딩 또는 기타 유형의 조언이나 권장 사항으로 간주되지 않으며, 트레이딩뷰에서 제공하거나 보증하는 것이 아닙니다. 자세한 내용은 이용 약관을 참조하세요.
오픈 소스 스크립트
트레이딩뷰의 진정한 정신에 따라, 이 스크립트의 작성자는 이를 오픈소스로 공개하여 트레이더들이 기능을 검토하고 검증할 수 있도록 했습니다. 작성자에게 찬사를 보냅니다! 이 코드는 무료로 사용할 수 있지만, 코드를 재게시하는 경우 하우스 룰이 적용된다는 점을 기억하세요.
면책사항
해당 정보와 게시물은 금융, 투자, 트레이딩 또는 기타 유형의 조언이나 권장 사항으로 간주되지 않으며, 트레이딩뷰에서 제공하거나 보증하는 것이 아닙니다. 자세한 내용은 이용 약관을 참조하세요.