PROTECTED SOURCE SCRIPT
Ema With Buy/Sell signals
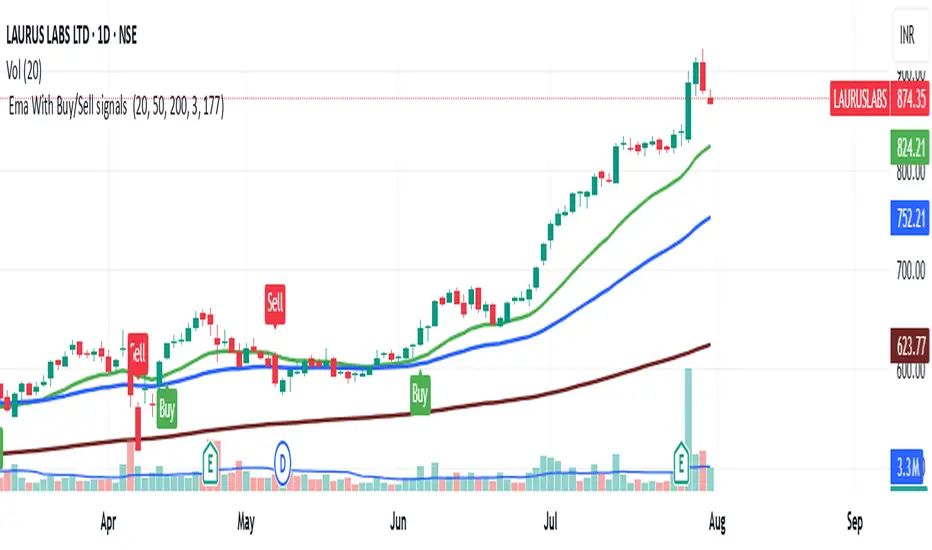
EMA With Buy/Sell Signals – Trend Following & Volatility Breakout Suite
This indicator delivers a powerful combination of trend clarity and actionable signal generation for traders of any skill level. It overlays three customizable Exponential Moving Averages (EMAs) with an adaptive ATR-based trailing stop and automatic Buy/Sell labels, allowing you to spot and capitalize on major market moves with confidence.
Core Features
Triple EMA Overlay (20, 50, 200):
Plots three EMAs with user-defined lengths, helping you visually identify trend direction and dynamic support/resistance zones.
EMA 1 (green): Fast and responsive to recent price moves.
EMA 2 (blue): Captures medium-term trend structure.
EMA 3 (Brown): Represents long-term trend and core support/resistance.
ATR-Based Trailing Stop & Signals:
Uses Average True Range (ATR) with a customizable lookback and multiplier to set an automated trailing stop that adjusts to volatility.
Buy labels trigger when price breaks above the trailing stop with bullish momentum; Sell labels trigger on bearish breaks below the stop.
Small, color-coded labels (green for Buy, red for Sell) are plotted directly on your chart for instant decision-making.
How to Use
Trend Trading: Follow the EMAs for overall trend direction; take Buy signals during uptrends and Sell signals during downtrends for higher accuracy.
Customization: Fine-tune EMA periods, ATR multiplier, and trailing stop period to fit any trading style—from scalping to long-term investing.
보호된 스크립트입니다
이 스크립트는 비공개 소스로 게시됩니다. 하지만 이를 자유롭게 제한 없이 사용할 수 있습니다 – 자세한 내용은 여기에서 확인하세요.
면책사항
해당 정보와 게시물은 금융, 투자, 트레이딩 또는 기타 유형의 조언이나 권장 사항으로 간주되지 않으며, 트레이딩뷰에서 제공하거나 보증하는 것이 아닙니다. 자세한 내용은 이용 약관을 참조하세요.
보호된 스크립트입니다
이 스크립트는 비공개 소스로 게시됩니다. 하지만 이를 자유롭게 제한 없이 사용할 수 있습니다 – 자세한 내용은 여기에서 확인하세요.
면책사항
해당 정보와 게시물은 금융, 투자, 트레이딩 또는 기타 유형의 조언이나 권장 사항으로 간주되지 않으며, 트레이딩뷰에서 제공하거나 보증하는 것이 아닙니다. 자세한 내용은 이용 약관을 참조하세요.