OPEN-SOURCE SCRIPT
ATR (Average True Range) mit relative/absolute Zahlen
GERMAN:
Schnelle Zusammenfassung:
Dieses Skript basiert auf dem ATR-Indikator und wurde so angepasst, dass sowohl relative (%) als auch absolute Zahlen angezeigt werden. Es bietet eine Darstellung des ATR in absoluten und prozentualen Werten sowie multipliziert mit den Faktoren x2, x2.5 und x3. Diese Darstellung erleichtert die Festlegung von Stop-Kursen, insbesondere für Trailing Stops und Trailing Abstände.
Periode:
Die Periode ist einstellbar und definiert die Länge der Berechnung des ATR (Standardwert: 14).
Glättung: Es stehen verschiedene Methoden zur Auswahl, um die Daten zu glätten (RMA, SMA, EMA, WMA).
Berechnungen:
ATR (Absolute Zahl): Berechnung der durchschnittlichen wahren Reichweite (ATR) unter Verwendung der ausgewählten Glättungsmethode und Periode.
ATR (Prozentualer Wert): Berechnung des ATR als Prozentsatz des aktuellen Schlusskurses.
Multiplikation des ATR: Berechnung des ATR multipliziert mit den Faktoren 2, 2.5 und 3 zur Einschätzung verschiedener Handelsszenarien.
Darstellung:
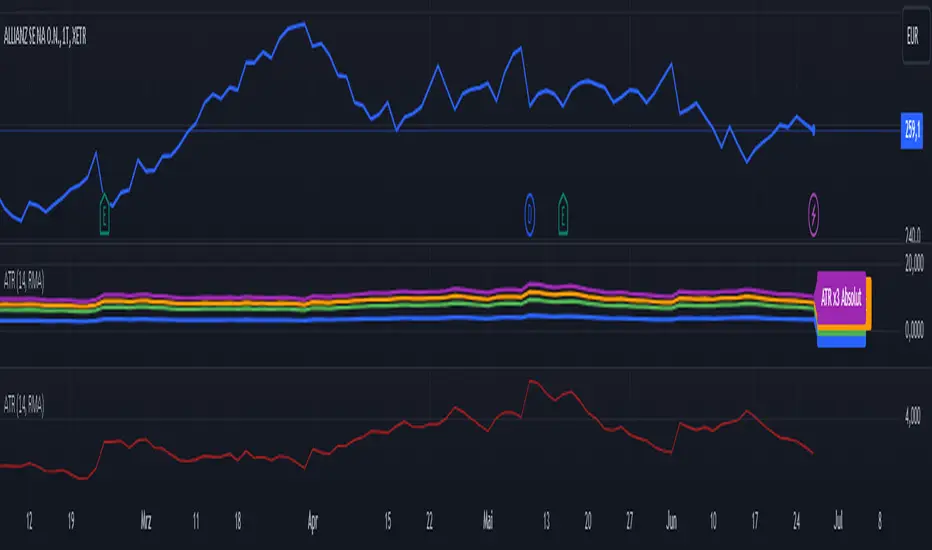
Absoluter ATR-Wert: Darstellung der absoluten ATR-Werte in Blau.
Relative ATR-Werte (%): Darstellung der prozentualen ATR-Werte, ohne Linie in der Grafik (transparent).
Multiplizierte ATR-Werte (x2, x2.5, x3): Darstellung der multiplizierten ATR-Werte in den Farben Grün (x2), Orange (x2.5) und Lila (x3).
Textbeschriftungen: Für jeden absoluten ATR-Wert und seine Multiplikationen werden Textbeschriftungen links im Chart angezeigt.
Verwendung des Indikators:
Dieser Indikator unterstützt Trader und Analysten dabei, die durchschnittliche wahre Reichweite (ATR) eines Finanzinstruments zu verstehen und zu visualisieren. Die verschiedenen Multiplikationen des ATR ermöglichen es, potenzielle Preisbewegungen zu analysieren und Handelsstrategien zu entwickeln, die auf der Volatilität basieren.
Hinweis:
Dies ist meine persönliche Meinung und Einstellung. Dieses Skript stellt keine Bankberatung oder Anlageempfehlung dar. Die Nutzung erfolgt auf eigenes Risiko und Verantwortung des Nutzers.
----------------------------------------------------------------------
ENGLISH:
Quick Summary:
This script is based on the ATR (Average True Range) indicator and has been modified to display both relative (%) and absolute values. It provides a representation of ATR in absolute and percentage terms, as well as multiplied by factors x2, x2.5, and x3. This visualization aids in setting stop-loss levels, especially for trailing stops and trailing distances.
Period:
The period is adjustable and defines the length of the ATR calculation (default: 14).
Smoothing: Various methods are available to smooth the data (RMA, SMA, EMA, WMA).
Calculations:
ATR (Absolute Value): Computes the Average True Range using the selected smoothing method and period.
ATR (Percentage Value): Calculates the ATR as a percentage of the current closing price.
Multiplication of ATR: Computes the ATR multiplied by factors 2, 2.5, and 3 to assess different trading scenarios.
Visualization:
Absolute ATR Value: Displays the absolute ATR values in blue.
Relative ATR Values (%): Shows the ATR values as percentages, without lines in the chart (transparent).
Multiplied ATR Values (x2, x2.5, x3): Presents the multiplied ATR values in green (x2), orange (x2.5), and purple (x3).
Text Labels: Text labels are shown on the left side of the chart for each absolute ATR value and its multiples.
Use of the Indicator:
This indicator helps traders and analysts understand and visualize the Average True Range (ATR) of a financial instrument. The different multipliers of ATR allow for the analysis of potential price movements and the development of trading strategies based on volatility.
Disclaimer:
This represents my personal opinion and viewpoint. This script does not constitute bank advice or investment recommendations. Use it at your own risk and responsibility.
Schnelle Zusammenfassung:
Dieses Skript basiert auf dem ATR-Indikator und wurde so angepasst, dass sowohl relative (%) als auch absolute Zahlen angezeigt werden. Es bietet eine Darstellung des ATR in absoluten und prozentualen Werten sowie multipliziert mit den Faktoren x2, x2.5 und x3. Diese Darstellung erleichtert die Festlegung von Stop-Kursen, insbesondere für Trailing Stops und Trailing Abstände.
Periode:
Die Periode ist einstellbar und definiert die Länge der Berechnung des ATR (Standardwert: 14).
Glättung: Es stehen verschiedene Methoden zur Auswahl, um die Daten zu glätten (RMA, SMA, EMA, WMA).
Berechnungen:
ATR (Absolute Zahl): Berechnung der durchschnittlichen wahren Reichweite (ATR) unter Verwendung der ausgewählten Glättungsmethode und Periode.
ATR (Prozentualer Wert): Berechnung des ATR als Prozentsatz des aktuellen Schlusskurses.
Multiplikation des ATR: Berechnung des ATR multipliziert mit den Faktoren 2, 2.5 und 3 zur Einschätzung verschiedener Handelsszenarien.
Darstellung:
Absoluter ATR-Wert: Darstellung der absoluten ATR-Werte in Blau.
Relative ATR-Werte (%): Darstellung der prozentualen ATR-Werte, ohne Linie in der Grafik (transparent).
Multiplizierte ATR-Werte (x2, x2.5, x3): Darstellung der multiplizierten ATR-Werte in den Farben Grün (x2), Orange (x2.5) und Lila (x3).
Textbeschriftungen: Für jeden absoluten ATR-Wert und seine Multiplikationen werden Textbeschriftungen links im Chart angezeigt.
Verwendung des Indikators:
Dieser Indikator unterstützt Trader und Analysten dabei, die durchschnittliche wahre Reichweite (ATR) eines Finanzinstruments zu verstehen und zu visualisieren. Die verschiedenen Multiplikationen des ATR ermöglichen es, potenzielle Preisbewegungen zu analysieren und Handelsstrategien zu entwickeln, die auf der Volatilität basieren.
Hinweis:
Dies ist meine persönliche Meinung und Einstellung. Dieses Skript stellt keine Bankberatung oder Anlageempfehlung dar. Die Nutzung erfolgt auf eigenes Risiko und Verantwortung des Nutzers.
----------------------------------------------------------------------
ENGLISH:
Quick Summary:
This script is based on the ATR (Average True Range) indicator and has been modified to display both relative (%) and absolute values. It provides a representation of ATR in absolute and percentage terms, as well as multiplied by factors x2, x2.5, and x3. This visualization aids in setting stop-loss levels, especially for trailing stops and trailing distances.
Period:
The period is adjustable and defines the length of the ATR calculation (default: 14).
Smoothing: Various methods are available to smooth the data (RMA, SMA, EMA, WMA).
Calculations:
ATR (Absolute Value): Computes the Average True Range using the selected smoothing method and period.
ATR (Percentage Value): Calculates the ATR as a percentage of the current closing price.
Multiplication of ATR: Computes the ATR multiplied by factors 2, 2.5, and 3 to assess different trading scenarios.
Visualization:
Absolute ATR Value: Displays the absolute ATR values in blue.
Relative ATR Values (%): Shows the ATR values as percentages, without lines in the chart (transparent).
Multiplied ATR Values (x2, x2.5, x3): Presents the multiplied ATR values in green (x2), orange (x2.5), and purple (x3).
Text Labels: Text labels are shown on the left side of the chart for each absolute ATR value and its multiples.
Use of the Indicator:
This indicator helps traders and analysts understand and visualize the Average True Range (ATR) of a financial instrument. The different multipliers of ATR allow for the analysis of potential price movements and the development of trading strategies based on volatility.
Disclaimer:
This represents my personal opinion and viewpoint. This script does not constitute bank advice or investment recommendations. Use it at your own risk and responsibility.
오픈 소스 스크립트
트레이딩뷰의 진정한 정신에 따라, 이 스크립트의 작성자는 이를 오픈소스로 공개하여 트레이더들이 기능을 검토하고 검증할 수 있도록 했습니다. 작성자에게 찬사를 보냅니다! 이 코드는 무료로 사용할 수 있지만, 코드를 재게시하는 경우 하우스 룰이 적용된다는 점을 기억하세요.
면책사항
해당 정보와 게시물은 금융, 투자, 트레이딩 또는 기타 유형의 조언이나 권장 사항으로 간주되지 않으며, 트레이딩뷰에서 제공하거나 보증하는 것이 아닙니다. 자세한 내용은 이용 약관을 참조하세요.
오픈 소스 스크립트
트레이딩뷰의 진정한 정신에 따라, 이 스크립트의 작성자는 이를 오픈소스로 공개하여 트레이더들이 기능을 검토하고 검증할 수 있도록 했습니다. 작성자에게 찬사를 보냅니다! 이 코드는 무료로 사용할 수 있지만, 코드를 재게시하는 경우 하우스 룰이 적용된다는 점을 기억하세요.
면책사항
해당 정보와 게시물은 금융, 투자, 트레이딩 또는 기타 유형의 조언이나 권장 사항으로 간주되지 않으며, 트레이딩뷰에서 제공하거나 보증하는 것이 아닙니다. 자세한 내용은 이용 약관을 참조하세요.