OPEN-SOURCE SCRIPT
Multi-Timeframe Support & Resistance
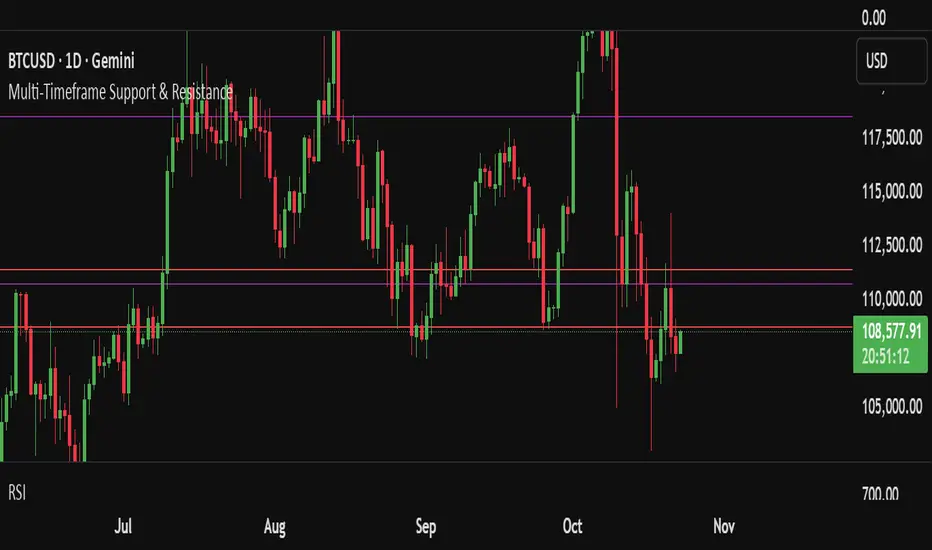
This indicator automatically plots dynamic support and resistance levels across multiple timeframes — including 1H, 4H, 1D, 1W, 1M, and the current chart timeframe. Each level is color-coded for clarity and extends across the chart to highlight key price zones.
**Key Features:**
- ⏱ Multi-timeframe analysis: 6 configurable timeframes
- 🎨 Custom color and style settings for each timeframe
- 📏 Adjustable number of levels per timeframe
- 🧼 Clean chart layout with no duplicate lines
- 🔄 Auto-refresh every 10 bars for up-to-date levels
Support and resistance levels are calculated using historical high/low ranges and evenly distributed across the selected lookback period. This helps traders identify confluence zones, breakout targets, and reversal areas with precision.
오픈 소스 스크립트
트레이딩뷰의 진정한 정신에 따라, 이 스크립트의 작성자는 이를 오픈소스로 공개하여 트레이더들이 기능을 검토하고 검증할 수 있도록 했습니다. 작성자에게 찬사를 보냅니다! 이 코드는 무료로 사용할 수 있지만, 코드를 재게시하는 경우 하우스 룰이 적용된다는 점을 기억하세요.
면책사항
해당 정보와 게시물은 금융, 투자, 트레이딩 또는 기타 유형의 조언이나 권장 사항으로 간주되지 않으며, 트레이딩뷰에서 제공하거나 보증하는 것이 아닙니다. 자세한 내용은 이용 약관을 참조하세요.
오픈 소스 스크립트
트레이딩뷰의 진정한 정신에 따라, 이 스크립트의 작성자는 이를 오픈소스로 공개하여 트레이더들이 기능을 검토하고 검증할 수 있도록 했습니다. 작성자에게 찬사를 보냅니다! 이 코드는 무료로 사용할 수 있지만, 코드를 재게시하는 경우 하우스 룰이 적용된다는 점을 기억하세요.
면책사항
해당 정보와 게시물은 금융, 투자, 트레이딩 또는 기타 유형의 조언이나 권장 사항으로 간주되지 않으며, 트레이딩뷰에서 제공하거나 보증하는 것이 아닙니다. 자세한 내용은 이용 약관을 참조하세요.