INVITE-ONLY SCRIPT
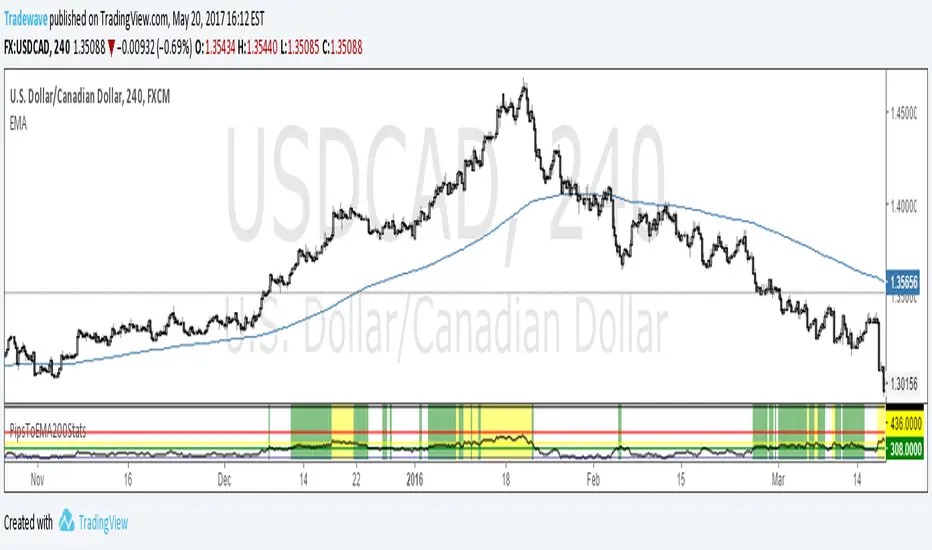
PipsToEMA200StatsV1.0
Creator: Andrew Palladino
Date: 5/20/2017
Description:
Plots distance in pips to 200 EMA .
Displays thresholds for vertical pip distance to 200 EMA calculated from 10 years worth of historical data.
Currently only working the following pairs:
"AUDCAD", "AUDCHF", "AUDJPY", "AUDNZD", "AUDSGD", "CADCHF", "CADJPY", "CHFJPY", "CHFSGD", "EURAUD", "EURCAD", "EURGBP", "EURJPY", "EURMXN", "EURNOK", "EURNZD", "EURUSD", "GBPAUD", "GBPCAD", "GBPCHF", "GBPJPY", "GBPNZD", "GBPNZD", "GBPUSD","NZDCAD", "NZDCHF", "NZDJPY", "NZDUSD", "USDCAD", "USDCHF", "USDJPY", "USDMXN"
Currently only working for the following time frames: m5, m15, h1, h4.
Current thresholds are set to:
90th percentile (green line)
95th percentile (yellow line)
99th percentile (orange line)
100th percentile (black line)
The oscillator measures vertical pip distance to 200 EMA . (BLACK LINE)
The trader has the ability to turn on/off the 4 thresholds in input properties.
The indicator background will turn green when pip distance is above green threshold and below yellow threshold.
The indicator background will turn yellow when pip distance is above yellow threshold and below red threshold.
The indicator background will turn red when pip distance is above red threshold
초대 전용 스크립트
이 스크립트는 작성자가 승인한 사용자만 접근할 수 있습니다. 사용하려면 요청 후 승인을 받아야 하며, 일반적으로 결제 후에 허가가 부여됩니다. 자세한 내용은 아래 작성자의 안내를 따르거나 LiquidityTracker에게 직접 문의하세요.
트레이딩뷰는 스크립트의 작동 방식을 충분히 이해하고 작성자를 완전히 신뢰하지 않는 이상, 해당 스크립트에 비용을 지불하거나 사용하는 것을 권장하지 않습니다. 커뮤니티 스크립트에서 무료 오픈소스 대안을 찾아보실 수도 있습니다.
작성자 지시 사항
면책사항
해당 정보와 게시물은 금융, 투자, 트레이딩 또는 기타 유형의 조언이나 권장 사항으로 간주되지 않으며, 트레이딩뷰에서 제공하거나 보증하는 것이 아닙니다. 자세한 내용은 이용 약관을 참조하세요.