INVITE-ONLY SCRIPT
업데이트됨 DMH‴ | Directional Movement Histogram‴
What does it do?
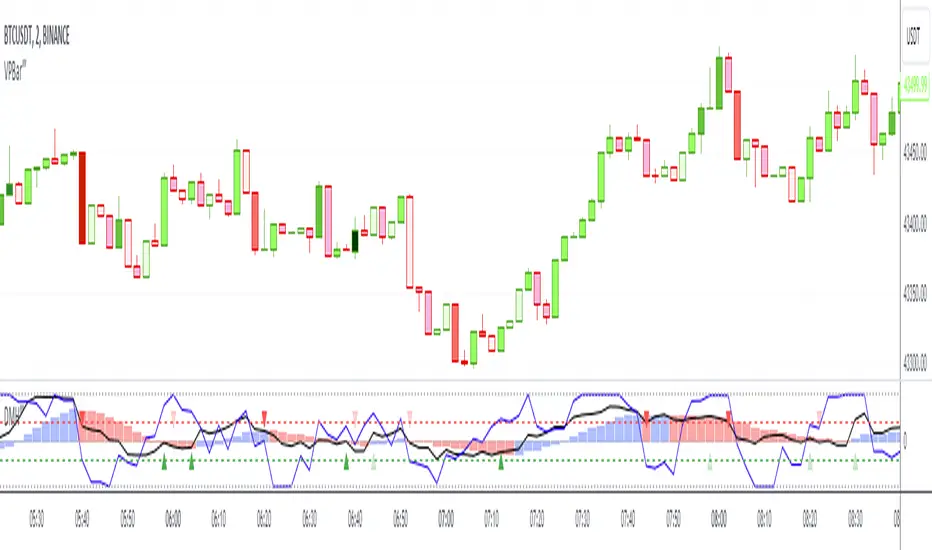
Converts all DMI lines into one line and represents the line behaviour in a histogram format, which provides more understanding of this indicator movement.
How does it work?
The better sell signal is given when the line crosses under the zero line (providing the 3of3 signal), but an antecipation of the selling opportunity is given when the line crosses under the top of its closest histrogram bar (providing the 1of3 signal). And vice-verse for the by signal.
When the line goes under the oversold zone, it won't take to long to move out of that zone providing us with the 2of3 signal), and vice-verse for the overbought zone.
You won't provided with all 3 signals at all time, once it depends on the line move, but the more signs you get, the earlier you can keep your eyes on a potential opportunity.
What's my filling?
Gives you a quick perception of the direction of the price move. When all indicators are showing the same direction and the DMH shows the other direction, I'd wait to see the DMH joining all other indicators. Until that happens, the price seams to get stuck.
Indicator features:
- red arrow above the histogram provides the line crossing under the top of its closest histogram bar, and a green arrow under the histogram provides the line crossing above the negative top of iths closest histogram bar
- Trend Color Bar: let the candlesticks show you the trend and its reversal
- Momentum Power: besides to the above features, you can add a momentum power indicator with arrow and/or moving average lines crossing
To have access to this indicator, please DM me.
Don't contact me in the comment area.
릴리즈 노트
This release includes a new line called "Reversal Line" that helps us spot potential price reversal.릴리즈 노트
Update just to fix chart image that was previously uploaded incorrectly.릴리즈 노트
Minor menu cleanup.릴리즈 노트
Color adjustment.초대 전용 스크립트
이 스크립트는 작성자가 승인한 사용자만 접근할 수 있습니다. 사용하려면 요청 후 승인을 받아야 하며, 일반적으로 결제 후에 허가가 부여됩니다. 자세한 내용은 아래 작성자의 안내를 따르거나 MarceloTorres에게 직접 문의하세요.
트레이딩뷰는 스크립트의 작동 방식을 충분히 이해하고 작성자를 완전히 신뢰하지 않는 이상, 해당 스크립트에 비용을 지불하거나 사용하는 것을 권장하지 않습니다. 커뮤니티 스크립트에서 무료 오픈소스 대안을 찾아보실 수도 있습니다.
작성자 지시 사항
To have access to this indicator, please DM me.
Don't contact me in the comment area.
TRADEWISER | Marcelo Torres
marcelo@tradewiser.pro
Vídeo-Análise completa diária no YouTube:
youtube.com/c/TradeWiserPro
Curso/AE
CursoAE.TradeWiser.pro
@TradeWiserPro
Telegram, Twitter, Facebook, LinkedIn, Instagram
marcelo@tradewiser.pro
Vídeo-Análise completa diária no YouTube:
youtube.com/c/TradeWiserPro
Curso/AE
CursoAE.TradeWiser.pro
@TradeWiserPro
Telegram, Twitter, Facebook, LinkedIn, Instagram
면책사항
해당 정보와 게시물은 금융, 투자, 트레이딩 또는 기타 유형의 조언이나 권장 사항으로 간주되지 않으며, 트레이딩뷰에서 제공하거나 보증하는 것이 아닙니다. 자세한 내용은 이용 약관을 참조하세요.
초대 전용 스크립트
이 스크립트는 작성자가 승인한 사용자만 접근할 수 있습니다. 사용하려면 요청 후 승인을 받아야 하며, 일반적으로 결제 후에 허가가 부여됩니다. 자세한 내용은 아래 작성자의 안내를 따르거나 MarceloTorres에게 직접 문의하세요.
트레이딩뷰는 스크립트의 작동 방식을 충분히 이해하고 작성자를 완전히 신뢰하지 않는 이상, 해당 스크립트에 비용을 지불하거나 사용하는 것을 권장하지 않습니다. 커뮤니티 스크립트에서 무료 오픈소스 대안을 찾아보실 수도 있습니다.
작성자 지시 사항
To have access to this indicator, please DM me.
Don't contact me in the comment area.
TRADEWISER | Marcelo Torres
marcelo@tradewiser.pro
Vídeo-Análise completa diária no YouTube:
youtube.com/c/TradeWiserPro
Curso/AE
CursoAE.TradeWiser.pro
@TradeWiserPro
Telegram, Twitter, Facebook, LinkedIn, Instagram
marcelo@tradewiser.pro
Vídeo-Análise completa diária no YouTube:
youtube.com/c/TradeWiserPro
Curso/AE
CursoAE.TradeWiser.pro
@TradeWiserPro
Telegram, Twitter, Facebook, LinkedIn, Instagram
면책사항
해당 정보와 게시물은 금융, 투자, 트레이딩 또는 기타 유형의 조언이나 권장 사항으로 간주되지 않으며, 트레이딩뷰에서 제공하거나 보증하는 것이 아닙니다. 자세한 내용은 이용 약관을 참조하세요.