PROTECTED SOURCE SCRIPT
Delta Histogram - OnlyFlow
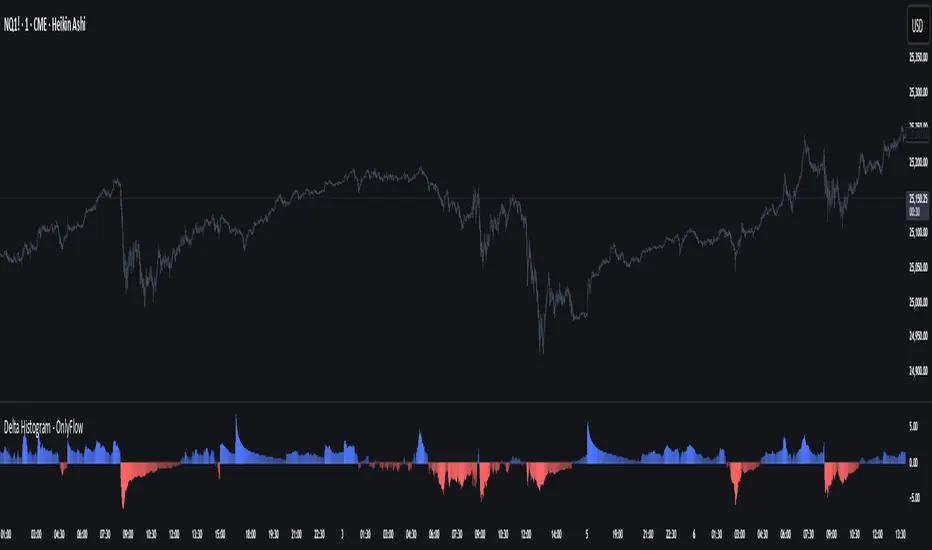
This script plots a histogram of delta proxies (approximations of buying vs. selling pressure) using available chart data. Because TradingView does not provide bid/ask tape data, delta is estimated with several selectable methods:
Uptick/Down-tick (proxy): volume signed by close direction.
Body-weighted Volume: weights volume by candle body relative to its range.
VWAP-slope Volume: signs volume by changes in the typical price (HLC3).
Features
Cumulative or per-bar mode: reset daily or by custom session hours.
Normalization options: Z-score, percentile scaling, or raw values; with percentile clipping for stable colors and axis scaling.
Visualization: color-coded positive/negative bars, optional zero line and ± bands, adjustable opacity scaling.
Readout Panel: shows the latest delta values and their normalized equivalents on the chart edge.
Alerts: triggers when normalized delta exceeds positive or negative thresholds, highlighting potential spikes in pressure.
Usage
Switch between delta modes to explore different perspectives on order-flow imbalance. Cumulative mode shows whether pressure builds over a session, while per-bar mode highlights bar-to-bar shifts. Normalization helps identify relative extremes in context rather than raw values.
보호된 스크립트입니다
이 스크립트는 비공개 소스로 게시됩니다. 하지만 이를 자유롭게 제한 없이 사용할 수 있습니다 – 자세한 내용은 여기에서 확인하세요.
면책사항
해당 정보와 게시물은 금융, 투자, 트레이딩 또는 기타 유형의 조언이나 권장 사항으로 간주되지 않으며, 트레이딩뷰에서 제공하거나 보증하는 것이 아닙니다. 자세한 내용은 이용 약관을 참조하세요.
면책사항
해당 정보와 게시물은 금융, 투자, 트레이딩 또는 기타 유형의 조언이나 권장 사항으로 간주되지 않으며, 트레이딩뷰에서 제공하거나 보증하는 것이 아닙니다. 자세한 내용은 이용 약관을 참조하세요.