OPEN-SOURCE SCRIPT
ShadowStats vs Official CPI YoY%
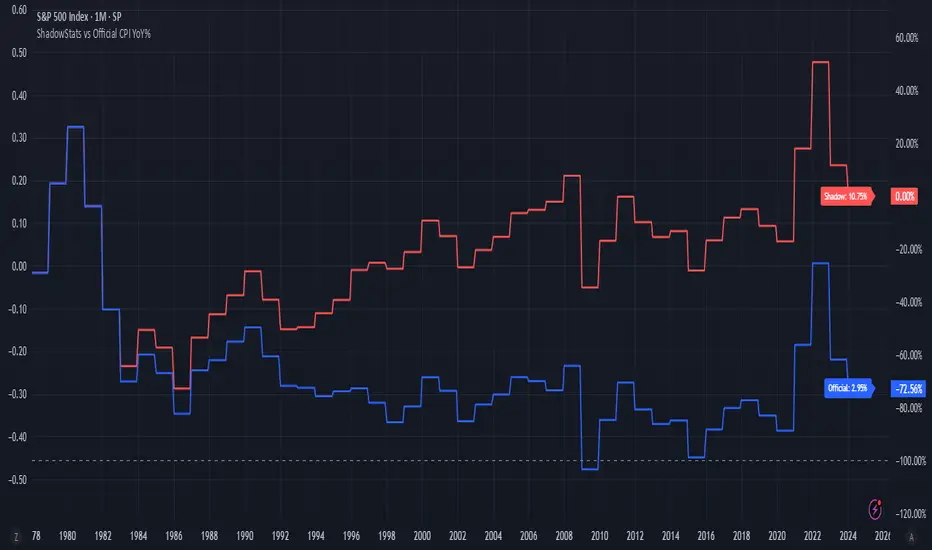
This chart visualizes and compares the year-over-year (YoY) percentage change in the Consumer Price Index (CPI) as calculated by the U.S. government versus the alternative methodology used by ShadowStats, which reflects pre-1980 inflation measurement techniques. The red line represents ShadowStats' CPI YoY% estimates, while the blue line shows the official CPI YoY% reported by government sources. This side-by-side view highlights the divergence in reported inflation rates over time, particularly from the 1980s onward, offering a visual representation of how different calculation methods can lead to vastly different interpretations of inflation and purchasing power loss.
오픈 소스 스크립트
트레이딩뷰의 진정한 정신에 따라, 이 스크립트의 작성자는 이를 오픈소스로 공개하여 트레이더들이 기능을 검토하고 검증할 수 있도록 했습니다. 작성자에게 찬사를 보냅니다! 이 코드는 무료로 사용할 수 있지만, 코드를 재게시하는 경우 하우스 룰이 적용된다는 점을 기억하세요.
면책사항
해당 정보와 게시물은 금융, 투자, 트레이딩 또는 기타 유형의 조언이나 권장 사항으로 간주되지 않으며, 트레이딩뷰에서 제공하거나 보증하는 것이 아닙니다. 자세한 내용은 이용 약관을 참조하세요.
오픈 소스 스크립트
트레이딩뷰의 진정한 정신에 따라, 이 스크립트의 작성자는 이를 오픈소스로 공개하여 트레이더들이 기능을 검토하고 검증할 수 있도록 했습니다. 작성자에게 찬사를 보냅니다! 이 코드는 무료로 사용할 수 있지만, 코드를 재게시하는 경우 하우스 룰이 적용된다는 점을 기억하세요.
면책사항
해당 정보와 게시물은 금융, 투자, 트레이딩 또는 기타 유형의 조언이나 권장 사항으로 간주되지 않으며, 트레이딩뷰에서 제공하거나 보증하는 것이 아닙니다. 자세한 내용은 이용 약관을 참조하세요.