OPEN-SOURCE SCRIPT
Elder Force Index Oscillator @shrilss
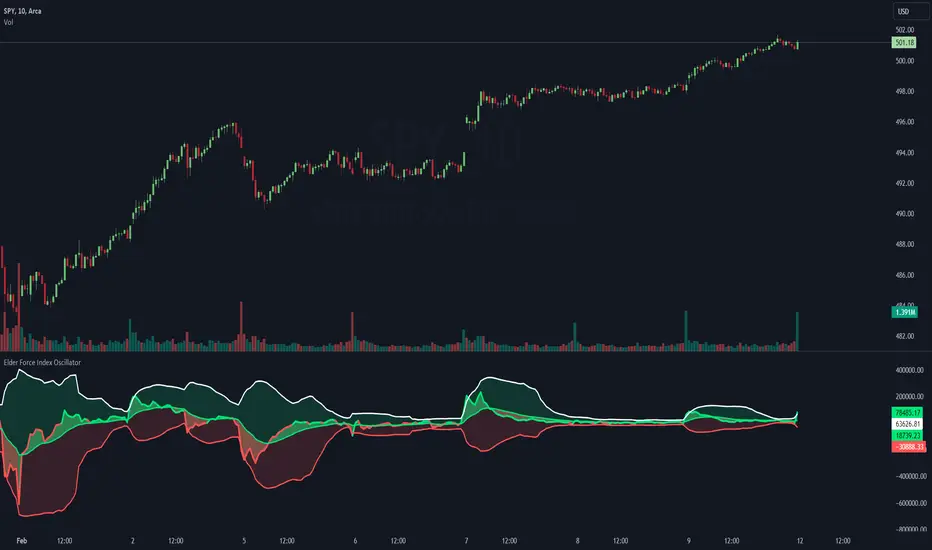
The "Elder Force Index Oscillator" is a comprehensive tool designed to assess the strength and direction of trends in the market. This indicator combines volume and price movement to provide traders with valuable insights into market dynamics.
Key Features:
- Volume Weighted: The oscillator considers both price changes and volume, emphasizing the significance of volume in confirming price movements.
- Trend Identification: Utilizing exponential moving averages (EMAs) and Bollinger Bands (BB), the indicator identifies potential trend reversals and continuations.
- Trend Strength Highlighting: With customizable options, the script highlights areas of strong and weak trend initiation, aiding traders in making informed decisions.
How It Works:
- Elder Force Index (EFI): The EFI is calculated as the EMA of price changes multiplied by volume. A positive value suggests buying pressure, while a negative value indicates selling pressure.
- EFI Moving Average (EFI MA): This smooths out the EFI, providing a clearer indication of trend direction.
- Bollinger Bands (BB): The upper and lower bands are calculated based on a specified number of standard deviations from the EFI's moving average, offering insights into potential overbought or oversold conditions.
오픈 소스 스크립트
트레이딩뷰의 진정한 정신에 따라, 이 스크립트의 작성자는 이를 오픈소스로 공개하여 트레이더들이 기능을 검토하고 검증할 수 있도록 했습니다. 작성자에게 찬사를 보냅니다! 이 코드는 무료로 사용할 수 있지만, 코드를 재게시하는 경우 하우스 룰이 적용된다는 점을 기억하세요.
면책사항
해당 정보와 게시물은 금융, 투자, 트레이딩 또는 기타 유형의 조언이나 권장 사항으로 간주되지 않으며, 트레이딩뷰에서 제공하거나 보증하는 것이 아닙니다. 자세한 내용은 이용 약관을 참조하세요.
오픈 소스 스크립트
트레이딩뷰의 진정한 정신에 따라, 이 스크립트의 작성자는 이를 오픈소스로 공개하여 트레이더들이 기능을 검토하고 검증할 수 있도록 했습니다. 작성자에게 찬사를 보냅니다! 이 코드는 무료로 사용할 수 있지만, 코드를 재게시하는 경우 하우스 룰이 적용된다는 점을 기억하세요.
면책사항
해당 정보와 게시물은 금융, 투자, 트레이딩 또는 기타 유형의 조언이나 권장 사항으로 간주되지 않으며, 트레이딩뷰에서 제공하거나 보증하는 것이 아닙니다. 자세한 내용은 이용 약관을 참조하세요.