OPEN-SOURCE SCRIPT
New RSI
📌 New RSI
The New RSI is a modern, enhanced version of the classic RSI created in 1978 — redesigned for today’s fast-moving markets, where algorithmic trading and AI dominate price action.
This indicator combines:
Adaptive RSI: Adjusts its calculation length in real time based on market volatility, making it more responsive during high volatility and smoother during calm periods.
Dynamic Bands: Upper and lower bands calculated from historical RSI volatility, helping you spot overbought/oversold conditions with greater accuracy.
Trend & Regime Filters: EMA and ADX-based detection to confirm signals only in favorable market conditions.
Volume Confirmation: Signals appear only when high trading volume supports the move — green volume for bullish setups and red volume for bearish setups — filtering out weak and unreliable trades.
💡 How it works:
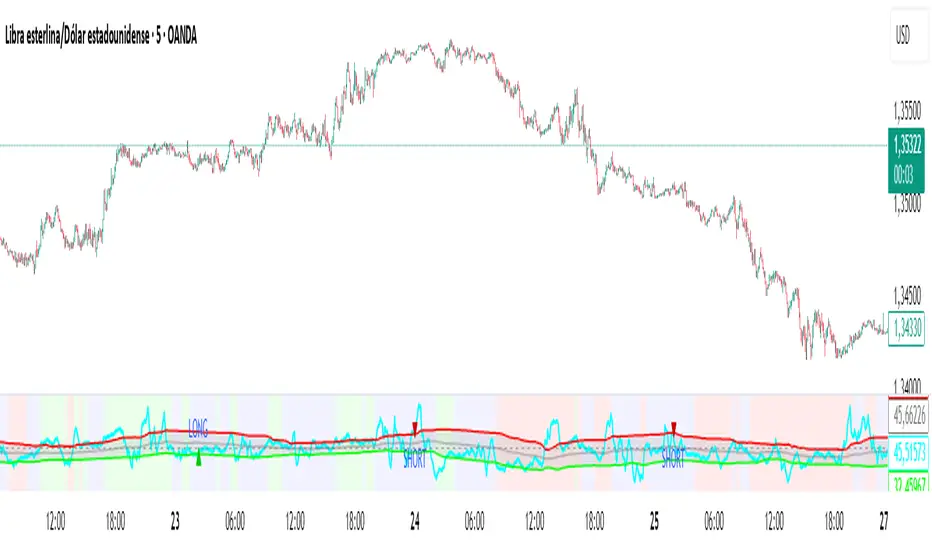
A LONG signal appears when RSI crosses above the lower band and the volume is high with a bullish candle.
A SHORT signal appears when RSI crosses below the upper band and the volume is high with a bearish candle.
Trend and higher timeframe filters (optional) can help improve precision and adapt to different trading styles.
✅ Best Use Cases:
Identify high-probability reversals or pullbacks with strong momentum confirmation.
Avoid false signals by trading only when volume validates the move.
Combine with your own support/resistance or price action strategy for even higher accuracy.
⚙️ Fully Customizable:
Adjustable RSI settings (length, volatility adaptation, smoothing)
Dynamic band sensitivity
Volume threshold multiplier
Higher timeframe RSI filter
Color-coded background for market regime visualization
This is not just another RSI — it’s a complete, next-gen momentum tool designed for traders who want accuracy, adaptability, and confirmation in every signal.
The New RSI is a modern, enhanced version of the classic RSI created in 1978 — redesigned for today’s fast-moving markets, where algorithmic trading and AI dominate price action.
This indicator combines:
Adaptive RSI: Adjusts its calculation length in real time based on market volatility, making it more responsive during high volatility and smoother during calm periods.
Dynamic Bands: Upper and lower bands calculated from historical RSI volatility, helping you spot overbought/oversold conditions with greater accuracy.
Trend & Regime Filters: EMA and ADX-based detection to confirm signals only in favorable market conditions.
Volume Confirmation: Signals appear only when high trading volume supports the move — green volume for bullish setups and red volume for bearish setups — filtering out weak and unreliable trades.
💡 How it works:
A LONG signal appears when RSI crosses above the lower band and the volume is high with a bullish candle.
A SHORT signal appears when RSI crosses below the upper band and the volume is high with a bearish candle.
Trend and higher timeframe filters (optional) can help improve precision and adapt to different trading styles.
✅ Best Use Cases:
Identify high-probability reversals or pullbacks with strong momentum confirmation.
Avoid false signals by trading only when volume validates the move.
Combine with your own support/resistance or price action strategy for even higher accuracy.
⚙️ Fully Customizable:
Adjustable RSI settings (length, volatility adaptation, smoothing)
Dynamic band sensitivity
Volume threshold multiplier
Higher timeframe RSI filter
Color-coded background for market regime visualization
This is not just another RSI — it’s a complete, next-gen momentum tool designed for traders who want accuracy, adaptability, and confirmation in every signal.
오픈 소스 스크립트
트레이딩뷰의 진정한 정신에 따라, 이 스크립트의 작성자는 이를 오픈소스로 공개하여 트레이더들이 기능을 검토하고 검증할 수 있도록 했습니다. 작성자에게 찬사를 보냅니다! 이 코드는 무료로 사용할 수 있지만, 코드를 재게시하는 경우 하우스 룰이 적용된다는 점을 기억하세요.
면책사항
해당 정보와 게시물은 금융, 투자, 트레이딩 또는 기타 유형의 조언이나 권장 사항으로 간주되지 않으며, 트레이딩뷰에서 제공하거나 보증하는 것이 아닙니다. 자세한 내용은 이용 약관을 참조하세요.
오픈 소스 스크립트
트레이딩뷰의 진정한 정신에 따라, 이 스크립트의 작성자는 이를 오픈소스로 공개하여 트레이더들이 기능을 검토하고 검증할 수 있도록 했습니다. 작성자에게 찬사를 보냅니다! 이 코드는 무료로 사용할 수 있지만, 코드를 재게시하는 경우 하우스 룰이 적용된다는 점을 기억하세요.
면책사항
해당 정보와 게시물은 금융, 투자, 트레이딩 또는 기타 유형의 조언이나 권장 사항으로 간주되지 않으며, 트레이딩뷰에서 제공하거나 보증하는 것이 아닙니다. 자세한 내용은 이용 약관을 참조하세요.