PROTECTED SOURCE SCRIPT
GR-DMI (Directional Movement Indicator with better colours)
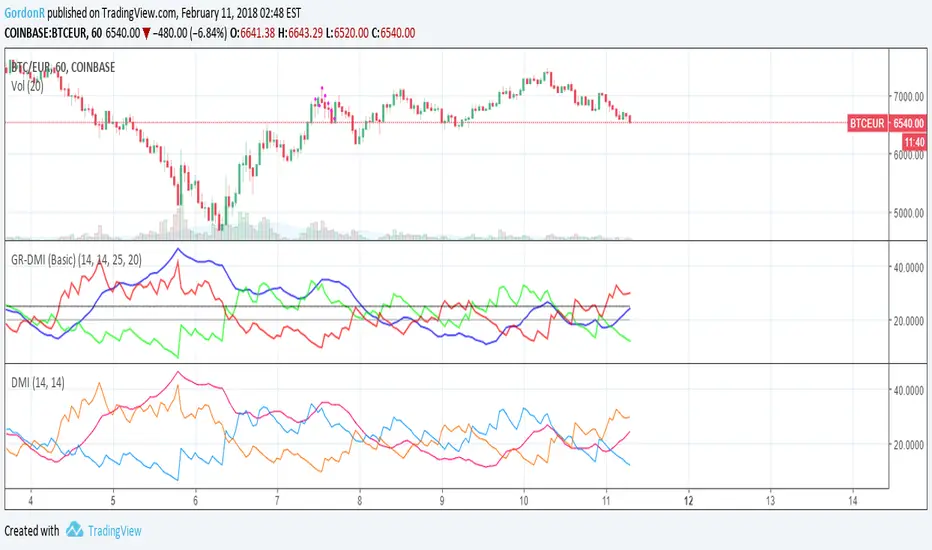
Standard DMI indicator, but with easier to understand colours and threshold lines.
I found myself constantly changing the colours every time I added the DMI indicator to a chart, so this indicator should fix that issue.
Green = Plus Directional Indicator ( +DI )
Red = Minus Directional Indicator ( -DI )
Blue = Average Directional Index ( ADX )
Comments and suggestions are most welcome.
I'm available for hire, to create custom indicators or to work on more complex software projects.
From (investopedia.com/ask/answers/121214/how-do-i-use-directional-movement-index-dmi-forex-trading.asp):
The directional movement index, or DMI, is a momentum indicator use to determine the existence of a trend and trend strength, and it can be utilized in forex trading as well as in stock or futures trading. It may even prove a more useful indicator in forex trading, as momentum indicators are popular with forex traders. The DMI calculates a moving average of range expansion over a given time period and is shown by two lines: the positive directional movement indicator, or +DMI , and the negative directional movement indicator, or -DMI .
The two DMI lines show the respective strengths of buying and selling pressure in a market. As with the popular Average Directional Index , or ADX , indicator, the use of both lines provides traders with the ability to assess buying and selling strength, indicating which is stronger, and also giving a relative indication of the amount of strength contained in a price movement by means of a scale going from zero to 100. A strong trend is revealed by a reading above 25 that occurs following one of the DMI lines crossing over above the other.
In a forex trading strategy, traders might make use of the DMI as a supporting, or confirming, indicator combined with a strategy primarily focused on price action and moving averages. It could also be used along with another momentum or range indicator to provide additional confirmation and help in choosing a good trade entry point. Once a trader's overall analysis suggests taking a position in a market, a possible trade entry point is provided when there is a crossover of the DMI lines or when, as mentioned above, the establishment of a firm trend is indicated by a DMI reading over 25.
보호된 스크립트입니다
이 스크립트는 비공개 소스로 게시됩니다. 하지만 이를 자유롭게 제한 없이 사용할 수 있습니다 – 자세한 내용은 여기에서 확인하세요.
면책사항
해당 정보와 게시물은 금융, 투자, 트레이딩 또는 기타 유형의 조언이나 권장 사항으로 간주되지 않으며, 트레이딩뷰에서 제공하거나 보증하는 것이 아닙니다. 자세한 내용은 이용 약관을 참조하세요.
면책사항
해당 정보와 게시물은 금융, 투자, 트레이딩 또는 기타 유형의 조언이나 권장 사항으로 간주되지 않으며, 트레이딩뷰에서 제공하거나 보증하는 것이 아닙니다. 자세한 내용은 이용 약관을 참조하세요.