OPEN-SOURCE SCRIPT
Risk On/Risk Off Williams %R
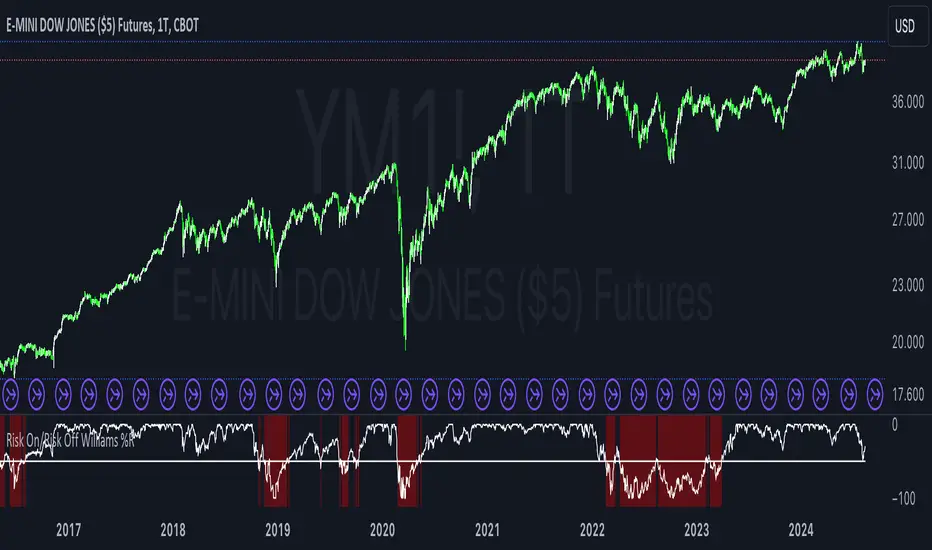
The Risk On/Risk Off Williams %R indicator is a technical analysis tool designed to gauge market sentiment by comparing the performance of risk-on and risk-off assets. This indicator combines the Williams %R, a momentum oscillator, with a composite index derived from various financial assets to determine the prevailing market risk sentiment.
Components:
Risk-On Assets: These are typically more volatile and are expected to perform well during bullish market conditions. The indicator uses the following risk-on assets:
SPY (S&P 500 ETF)
QQQ (Nasdaq-100 ETF)
HYG (High-Yield Corporate Bond ETF)
XLF (Financial Select Sector SPDR Fund)
XLK (Technology Select Sector SPDR Fund)
Risk-Off Assets: These are generally considered safer investments and are expected to outperform during bearish market conditions. The indicator includes:
TLT (iShares 20+ Year Treasury Bond ETF)
GLD (SPDR Gold Trust)
DXY (U.S. Dollar Index)
IEF (iShares 7-10 Year Treasury Bond ETF)
XLU (Utilities Select Sector SPDR Fund)
Calculation:
Risk-On Index: The average closing price of the risk-on assets.
Risk-Off Index: The average closing price of the risk-off assets.
The composite index is computed as:
Composite Index=Risk On Index−Risk Off Index
Composite Index=Risk On Index−Risk Off Index
Williams %R: This momentum oscillator measures the current price relative to the high-low range over a specified period. It is calculated as:
\text{Williams %R} = \frac{\text{Highest High} - \text{Composite Index}}{\text{Highest High} - \text{Lowest Low}} \times -100
where "Highest High" and "Lowest Low" are the highest and lowest values of the composite index over the lookback period.
Usage:
Williams %R: A momentum oscillator that ranges from -100 to 0. Values above -50 suggest bullish conditions, while values below -50 indicate bearish conditions.
Background Color: The background color of the chart changes based on the Williams %R relative to a predefined threshold level:
Green background: When Williams %R is above the threshold level, indicating a bullish sentiment.
Red background: When Williams %R is below the threshold level, indicating a bearish sentiment.
Purpose:
The indicator is designed to provide a visual representation of market sentiment by comparing the performance of risk-on versus risk-off assets. It helps traders and investors understand whether the market is leaning towards higher risk (risk-on) or safety (risk-off) based on the relative performance of these asset classes. By incorporating the Williams %R, the indicator adds a momentum-based dimension to this analysis, allowing for better decision-making in response to shifting market conditions.
오픈 소스 스크립트
트레이딩뷰의 진정한 정신에 따라, 이 스크립트의 작성자는 이를 오픈소스로 공개하여 트레이더들이 기능을 검토하고 검증할 수 있도록 했습니다. 작성자에게 찬사를 보냅니다! 이 코드는 무료로 사용할 수 있지만, 코드를 재게시하는 경우 하우스 룰이 적용된다는 점을 기억하세요.
Where others speculate, we systematize.
edgetools.org
edgetools.org
면책사항
해당 정보와 게시물은 금융, 투자, 트레이딩 또는 기타 유형의 조언이나 권장 사항으로 간주되지 않으며, 트레이딩뷰에서 제공하거나 보증하는 것이 아닙니다. 자세한 내용은 이용 약관을 참조하세요.