OPEN-SOURCE SCRIPT
Candle + Volume as Histogram
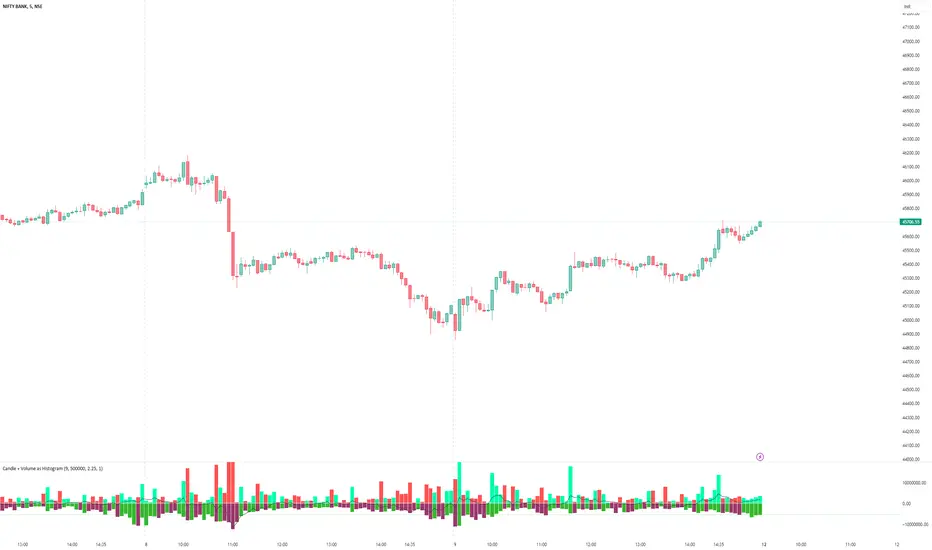
Now plot Candle and Volume as Histogram Oscillator. It is a very simple but very effective indicator to see what is happening at Volume and Candle levels. It clearly plots whether the market is trending, volatile, what is going to happen in next candles etc. Above Zero is price candle and below Zero is Volume histogram.
SETTINGS:
EMA : 9 period EMA on price is default, which I find the best, but you can change as you likes. Below zero line shows market is in negative phase and above zero market is positive.
PRICE CANDLE : As price and volume have different numeric value, so you have to use multiplier to set the proper price candle, which is plotted above zero
VOLUME : As price and volume have different numeric value, so you have to use multiplier to set the Volume candle, which is plotted below zero.
ZERO LINE : use ‘Gap between Candle and Volume plotting’. Increase the value until you see a thin line between price and volume histogram.
NOTE: (i) When you will plot the indicator for the first time, either price candle may not be appearing properly or volume. It means that non-appearing histogram side needs multiplication, so keep on increasing value on proper side until both side histogram appears properly.
(ii) In other case. Price or volume histogram may appear as full Candle. In this case too, you need to increase multiplier value on opposite side till value becomes equal on both sides.
These settings are important because a share price can be 10 only whereas volume may be in millions. Indicator has been tested on many shares and indexes, so never feels that indicator is improper. Just try to change the setting.
Enjoy.
오픈 소스 스크립트
트레이딩뷰의 진정한 정신에 따라, 이 스크립트의 작성자는 이를 오픈소스로 공개하여 트레이더들이 기능을 검토하고 검증할 수 있도록 했습니다. 작성자에게 찬사를 보냅니다! 이 코드는 무료로 사용할 수 있지만, 코드를 재게시하는 경우 하우스 룰이 적용된다는 점을 기억하세요.
면책사항
해당 정보와 게시물은 금융, 투자, 트레이딩 또는 기타 유형의 조언이나 권장 사항으로 간주되지 않으며, 트레이딩뷰에서 제공하거나 보증하는 것이 아닙니다. 자세한 내용은 이용 약관을 참조하세요.
오픈 소스 스크립트
트레이딩뷰의 진정한 정신에 따라, 이 스크립트의 작성자는 이를 오픈소스로 공개하여 트레이더들이 기능을 검토하고 검증할 수 있도록 했습니다. 작성자에게 찬사를 보냅니다! 이 코드는 무료로 사용할 수 있지만, 코드를 재게시하는 경우 하우스 룰이 적용된다는 점을 기억하세요.
면책사항
해당 정보와 게시물은 금융, 투자, 트레이딩 또는 기타 유형의 조언이나 권장 사항으로 간주되지 않으며, 트레이딩뷰에서 제공하거나 보증하는 것이 아닙니다. 자세한 내용은 이용 약관을 참조하세요.