PROTECTED SOURCE SCRIPT
Trade Checklist RSI BollingerBands UP/DOWN Days
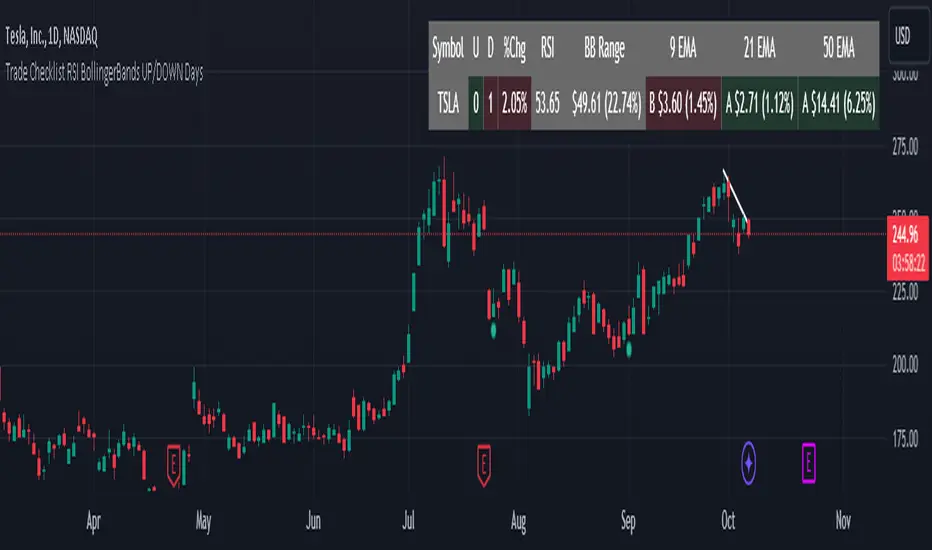
This new indicator combines several key technical analysis components to provide traders with a clear, actionable view of market conditions. By integrating consecutive up/down days, RSI, Bollinger Bands, and multiple EMAs (9, 21, and 50), this tool helps identify potential entry and exit points with precision.
Consecutive Up/Down Days: Helps assess momentum by tracking how many days the stock has been moving in one direction, allowing traders to identify overextended trends.
RSI (Relative Strength Index): Provides insights into overbought and oversold conditions, allowing users to gauge the strength of price movements.
Bollinger Bands: Offers a view of volatility, with the proximity of the price to the upper or lower bands signaling potential breakout or reversal opportunities.
9, 21, and 50 EMAs: These EMAs work together to show short, medium, and longer-term trend dynamics. By tracking how far the price is from each EMA in both dollar and percentage terms, traders can easily spot trends, pullbacks, and mean reversion opportunities.
Why This Combination? Each component serves a distinct role, and together they provide a fuller picture of market conditions. The EMAs offer trend direction and potential reversal points, while the RSI and Bollinger Bands assess volatility and momentum. This multi-layered approach allows traders to make informed decisions and avoid relying on any one technical factor, helping them spot high-probability trade setups, such as mean reversion opportunities.
This indicator streamlines technical analysis into one easy-to-read table, eliminating the need for cluttered charts, and enabling traders to quickly assess the market before taking a position.
보호된 스크립트입니다
이 스크립트는 비공개 소스로 게시됩니다. 하지만 이를 자유롭게 제한 없이 사용할 수 있습니다 – 자세한 내용은 여기에서 확인하세요.
면책사항
해당 정보와 게시물은 금융, 투자, 트레이딩 또는 기타 유형의 조언이나 권장 사항으로 간주되지 않으며, 트레이딩뷰에서 제공하거나 보증하는 것이 아닙니다. 자세한 내용은 이용 약관을 참조하세요.
면책사항
해당 정보와 게시물은 금융, 투자, 트레이딩 또는 기타 유형의 조언이나 권장 사항으로 간주되지 않으며, 트레이딩뷰에서 제공하거나 보증하는 것이 아닙니다. 자세한 내용은 이용 약관을 참조하세요.