OPEN-SOURCE SCRIPT
Average True Range Normalized

Introduction
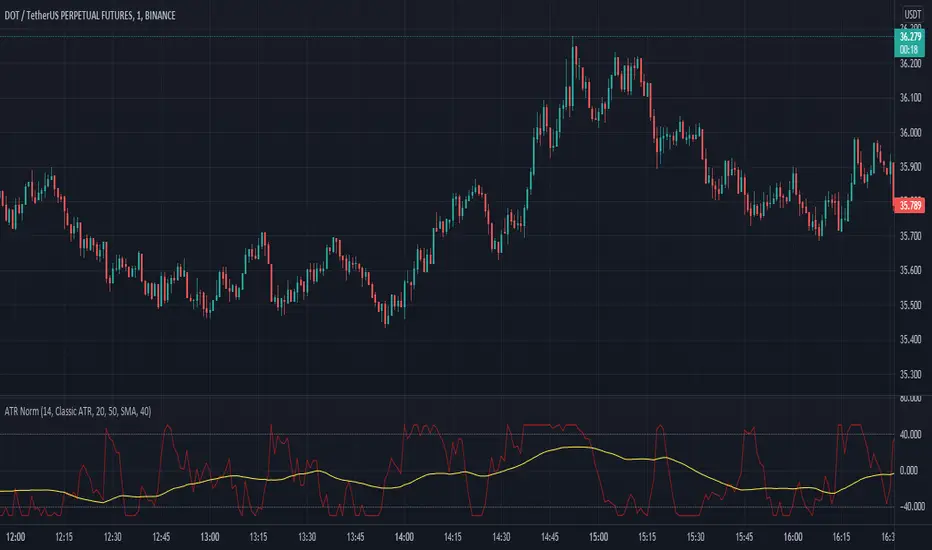
This simple script is the normalization of the common ATR indicator. The utility in normalization, in this case, is the contextualization of the absolute movements of the ATR compared to the previous candles. Not finding an indicator that reflected my needs, I created it and decided to make it available to the community.
The oscillator is fully based on the original ATR indicator, once normalized it varies its values between -50 and +50 and has a moving average based on it.
I added alarms:
- crossing of horizontal levels (default +40 -40)
- crossing of the moving average
Settings
ATR period: like a normal ATR indicator, the number of candles on which the ATR calculation is based
Smooth: like normal ATR indicator, type of moving average to smooth true range values
Normalization Period: Number of candles on which ATR normalization is based, it takes the maximum and the minimum values in the last N candles and creates the value -50 and +50, between these two values normalize the others.
MA Period: Period of MA based on ATR, this MA can be used like moving level to find the moment of low volatility
Type: Kind of MA, you can choose only between 3 types ( SMA, EMA, WMA )
Horizontal Lines Value: high and low level for high and low volatility
Alert on crossing Horizontal lines: enable alerts on crossing Horizontal Lines
Alert on crossing MA: enable alerts on crossing Moving Average
How to use
ATR isn't a directional indicator, but volatility is fuel for markets, low ATR values indicate quiet moments or consolidation movements, otherwise high ATR values indicate selling or buying pressure. A reversal in price with an increase in ATR would indicate strength behind that move.
The problem, for me, with normal ATR is that often the values have to be contextualized with older values, on the contrary being normalized you can:
- catch small fluctuations, and anticipate the decline;
- contextualize the values without having to look at the history in the previous candles
So:
- under MA or horizontal line the volatility is too low, it would be advisable to consider not opening positions;
- over MA line the volatility is raising and a reversal in price with an increase in ATR would indicate strength behind that move;
Remember that every statistical indicator is just a tool, it needs to be understood to be used at its best, otherwise, it is just a colored line in a colored graph.
오픈 소스 스크립트
트레이딩뷰의 진정한 정신에 따라, 이 스크립트의 작성자는 이를 오픈소스로 공개하여 트레이더들이 기능을 검토하고 검증할 수 있도록 했습니다. 작성자에게 찬사를 보냅니다! 이 코드는 무료로 사용할 수 있지만, 코드를 재게시하는 경우 하우스 룰이 적용된다는 점을 기억하세요.
면책사항
해당 정보와 게시물은 금융, 투자, 트레이딩 또는 기타 유형의 조언이나 권장 사항으로 간주되지 않으며, 트레이딩뷰에서 제공하거나 보증하는 것이 아닙니다. 자세한 내용은 이용 약관을 참조하세요.
오픈 소스 스크립트
트레이딩뷰의 진정한 정신에 따라, 이 스크립트의 작성자는 이를 오픈소스로 공개하여 트레이더들이 기능을 검토하고 검증할 수 있도록 했습니다. 작성자에게 찬사를 보냅니다! 이 코드는 무료로 사용할 수 있지만, 코드를 재게시하는 경우 하우스 룰이 적용된다는 점을 기억하세요.
면책사항
해당 정보와 게시물은 금융, 투자, 트레이딩 또는 기타 유형의 조언이나 권장 사항으로 간주되지 않으며, 트레이딩뷰에서 제공하거나 보증하는 것이 아닙니다. 자세한 내용은 이용 약관을 참조하세요.