OPEN-SOURCE SCRIPT
업데이트됨 OECD CLI Diffusion Index
What does the indicator measure?
This is a macro indicator. It uses OECD's composite leading indicator - see details about the CLI below.
What it does it calculate YoY changes for CLI of 38 countries that are members or are associated with the OECD. Then it measures a percent of countries which CLI is rising.
How this can be used?
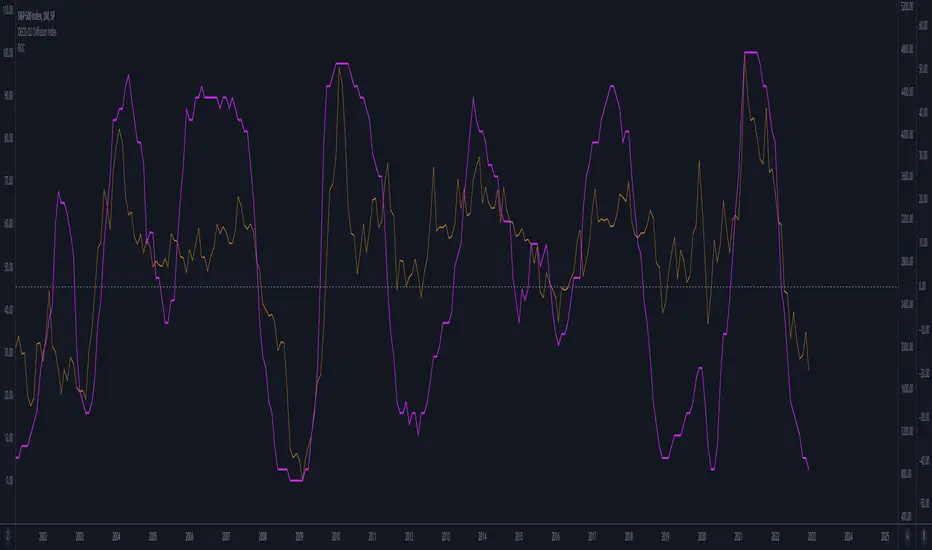
The positive slope of the curve means that there probably will be an economic growth among those countries within next 6 - 9 months. The negative slope means there probably will be an economic contraction.
Forward-looking economic growth is correlated with positive S&P 500 YoY growth (equity markets are also forward looking). The chart above presents the CLI diffusion index with overlayed S&P500 YoY rate of change.
The CLI is also correlated with ISM PMI - see example below:

What is a CLI?
"The OECD system of Composite Leading Indicators (CLIs) is designed to provide early signals of turning points in business cycles - fluctuation in the output gap, i.e. fluctuation of the economic activity around its long term potential level. This approach, focusing on turning points (peaks and troughs), results in CLIs that provide qualitative rather than quantitative information on short-term economic movements."
This is a macro indicator. It uses OECD's composite leading indicator - see details about the CLI below.
What it does it calculate YoY changes for CLI of 38 countries that are members or are associated with the OECD. Then it measures a percent of countries which CLI is rising.
How this can be used?
The positive slope of the curve means that there probably will be an economic growth among those countries within next 6 - 9 months. The negative slope means there probably will be an economic contraction.
Forward-looking economic growth is correlated with positive S&P 500 YoY growth (equity markets are also forward looking). The chart above presents the CLI diffusion index with overlayed S&P500 YoY rate of change.
The CLI is also correlated with ISM PMI - see example below:
What is a CLI?
"The OECD system of Composite Leading Indicators (CLIs) is designed to provide early signals of turning points in business cycles - fluctuation in the output gap, i.e. fluctuation of the economic activity around its long term potential level. This approach, focusing on turning points (peaks and troughs), results in CLIs that provide qualitative rather than quantitative information on short-term economic movements."
릴리즈 노트
Another reason to look at CLI Diffusion Index is its relationship with the volatility. Table below presents the distribition of VIX spikes over 35 among ten buckets of the index - where first bucket consists of index values of 0%-10% and the last one 90%-100%.Additional idea on how to use the index is to look at securities that the most sensitive to economic changes. Below are YoY rate of changes of Russell 2000 and Copper futures.
릴리즈 노트
I changed how CLI data is pulled - instead of using data.nasdaq.com (which does not store the data anymore) - the code uses TW data.However, additional change comes from OECD. They previously published data for all OECD members and some associated countries. Now it is limited only to G20 countries (TW allows us to get only 16 coutries). Go to OECD's website to get more details on that.
릴리즈 노트
Just minor code cleaning.오픈 소스 스크립트
트레이딩뷰의 진정한 정신에 따라, 이 스크립트의 작성자는 이를 오픈소스로 공개하여 트레이더들이 기능을 검토하고 검증할 수 있도록 했습니다. 작성자에게 찬사를 보냅니다! 이 코드는 무료로 사용할 수 있지만, 코드를 재게시하는 경우 하우스 룰이 적용된다는 점을 기억하세요.
면책사항
해당 정보와 게시물은 금융, 투자, 트레이딩 또는 기타 유형의 조언이나 권장 사항으로 간주되지 않으며, 트레이딩뷰에서 제공하거나 보증하는 것이 아닙니다. 자세한 내용은 이용 약관을 참조하세요.
오픈 소스 스크립트
트레이딩뷰의 진정한 정신에 따라, 이 스크립트의 작성자는 이를 오픈소스로 공개하여 트레이더들이 기능을 검토하고 검증할 수 있도록 했습니다. 작성자에게 찬사를 보냅니다! 이 코드는 무료로 사용할 수 있지만, 코드를 재게시하는 경우 하우스 룰이 적용된다는 점을 기억하세요.
면책사항
해당 정보와 게시물은 금융, 투자, 트레이딩 또는 기타 유형의 조언이나 권장 사항으로 간주되지 않으며, 트레이딩뷰에서 제공하거나 보증하는 것이 아닙니다. 자세한 내용은 이용 약관을 참조하세요.