PROTECTED SOURCE SCRIPT
업데이트됨 RED: Momentum
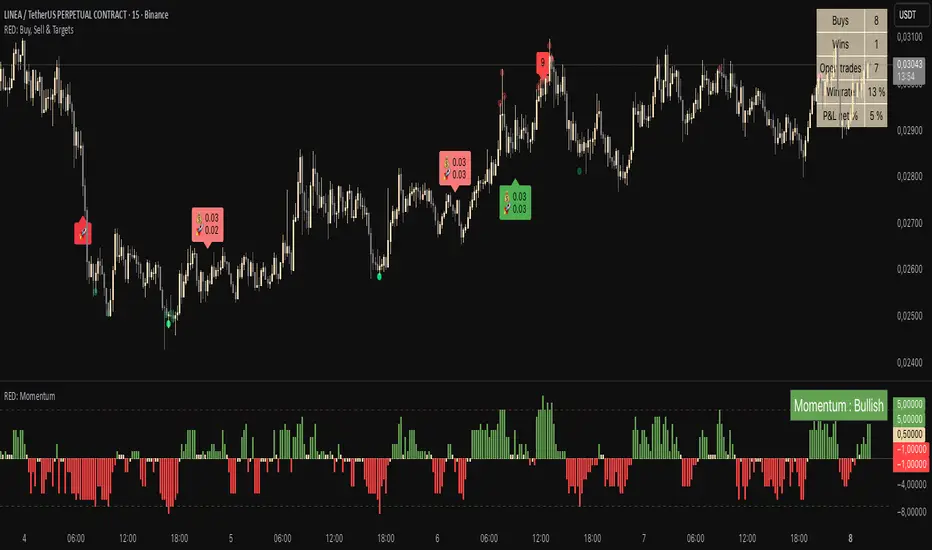
RED: Momentum Panel
This indicator is designed to track the balance of buying and selling pressure in the market and highlight key momentum phases.
It simplifies complex conditions into clear momentum states, helping traders quickly understand whether the market is in a strong zone or transitioning.
- Top zones → when selling pressure reaches extreme levels.
- Bottom zones → when buying pressure reaches extreme levels.
- Momentum Bearish → when momentum shifts down after a strong top.
- Momentum Bullish → when momentum shifts up after a strong bottom.
The panel uses a scoring system in the background to filter noise and show only the dominant side (Buy vs Sell).
Horizontal thresholds make it easy to spot when the market enters or exits extreme conditions.
This tool is not meant to give signals by itself but to provide an intuitive view of where momentum stands right now, top, bottom, bullish, or bearish, at a glance.
릴리즈 노트
Update릴리즈 노트
Update릴리즈 노트
Update릴리즈 노트
Update보호된 스크립트입니다
이 스크립트는 비공개 소스로 게시됩니다. 하지만 제한 없이 자유롭게 사용할 수 있습니다 — 여기에서 자세히 알아보기.
면책사항
이 정보와 게시물은 TradingView에서 제공하거나 보증하는 금융, 투자, 거래 또는 기타 유형의 조언이나 권고 사항을 의미하거나 구성하지 않습니다. 자세한 내용은 이용 약관을 참고하세요.
보호된 스크립트입니다
이 스크립트는 비공개 소스로 게시됩니다. 하지만 제한 없이 자유롭게 사용할 수 있습니다 — 여기에서 자세히 알아보기.
면책사항
이 정보와 게시물은 TradingView에서 제공하거나 보증하는 금융, 투자, 거래 또는 기타 유형의 조언이나 권고 사항을 의미하거나 구성하지 않습니다. 자세한 내용은 이용 약관을 참고하세요.