PROTECTED SOURCE SCRIPT
Economic Macro Dashboard (DeadCat)
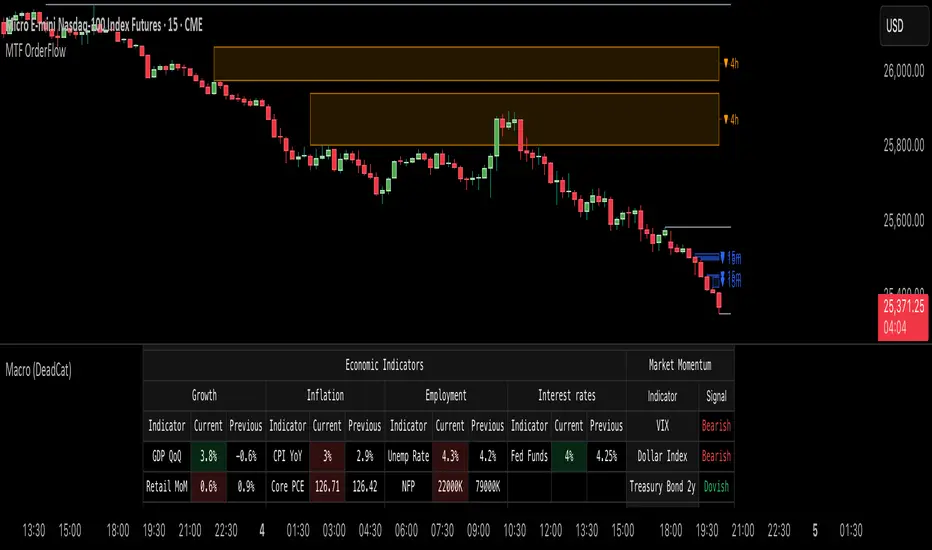
This indicator provides a compact, data-driven view of key U.S. macroeconomic conditions and market sentiment — directly on your TradingView chart.
The dashboard aggregates several fundamental datasets from TradingView’s built-in *economic data feeds* (such as CPI, GDP growth, Fed Funds Rate, NFP, and Unemployment), along with major market benchmarks (VIX, DXY, Gold, and 2-Year Treasury Yield). It tracks the latest value and change from the previous update to evaluate short-term macro trends.
Each group of indicators contributes to four composite scores:
Growth: Based on changes in GDP and Retail Sales.
Inflation: Tracks CPI and Core PCE directionality.
Employment: Evaluates NFP and Unemployment Rate dynamics.
Interest Rates: Interprets movement in the Federal Funds Rate.
These metrics are converted into normalized 0–100 “condition scores,” color-coded as *Rising, Neutral,* or *Declining* for easier interpretation.
The script then summarizes the overall macro tone (growth, inflation, employment, rates) in a structured table that updates automatically.
On the market side, it uses moving average relationships (EMA crossovers on VIX, DXY, and Gold, plus SMA trend on 2-Year Treasury yields) to infer short-term momentum in risk sentiment, the dollar, and safe-haven assets. This helps traders contextualize market positioning relative to macro developments.
Core concept:
The script acts as a **real-time economic sentiment dashboard**, bridging fundamental data and technical market conditions in one view. It’s designed for traders who want to visually monitor macro shifts without leaving their charts — useful for both short-term market bias and long-term context.
How to use:
Apply the indicator to any chart or timeframe.
Use the table position and size inputs to arrange it on your layout.
Watch for consistent trends:
-Rising growth + strong employment → supportive macro tone.
-Rising inflation + hawkish rates → tightening bias.
-DXY/VIX trends can confirm or contradict the macro tone.
Note:
No future data is used. All economic series are fetched via TradingView’s `request.economic()` and market benchmarks via `request.security()` in daily resolution.
This tool is for visualization and analysis only — not a buy/sell signal generator.
보호된 스크립트입니다
이 스크립트는 비공개 소스로 게시됩니다. 하지만 제한 없이 자유롭게 사용할 수 있습니다 — 여기에서 자세히 알아보기.
면책사항
이 정보와 게시물은 TradingView에서 제공하거나 보증하는 금융, 투자, 거래 또는 기타 유형의 조언이나 권고 사항을 의미하거나 구성하지 않습니다. 자세한 내용은 이용 약관을 참고하세요.
보호된 스크립트입니다
이 스크립트는 비공개 소스로 게시됩니다. 하지만 제한 없이 자유롭게 사용할 수 있습니다 — 여기에서 자세히 알아보기.
면책사항
이 정보와 게시물은 TradingView에서 제공하거나 보증하는 금융, 투자, 거래 또는 기타 유형의 조언이나 권고 사항을 의미하거나 구성하지 않습니다. 자세한 내용은 이용 약관을 참고하세요.