PROTECTED SOURCE SCRIPT
Top 5 Trend [KintsugiTrading]
Top 5 Trend [KintsugiTrading]
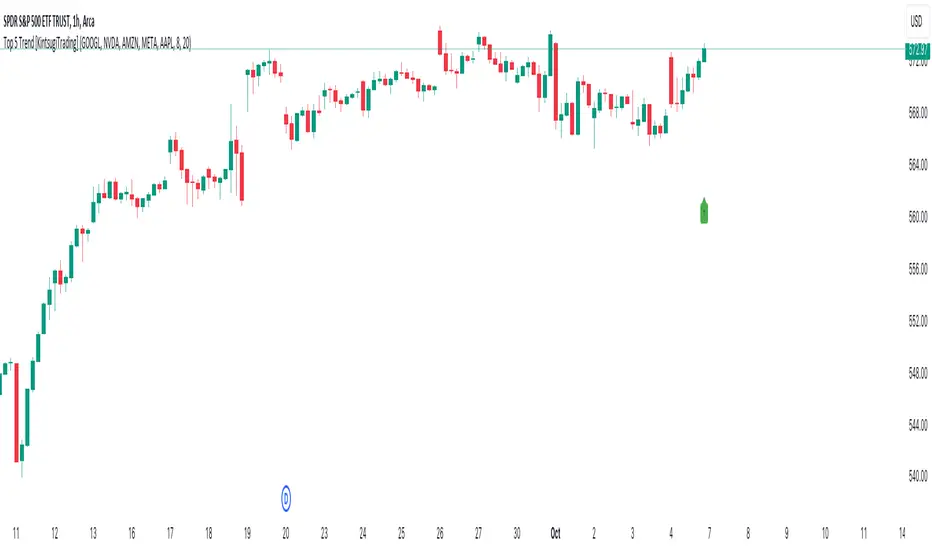
This script provides a visual indicator for tracking the average trend of five selected stocks. By calculating the exponential moving average (EMA) of the closing price of the five selected stocks, the indicator helps users quickly assess overall market sentiment. The indicator's original purpose was to inform the user of the direction of the five largest stocks that make up ~25% of the S&P 500.
Key Features:
This indicator is perfect for traders who want to monitor the combined movement of a group of major stocks in order to easily compare strengths or weaknesses. It is a key visual aid in understanding if the overall sentiment is bullish or bearish based on the selected stocks' performance, thus making sure the user is always trading on the right side of momentum.
This script provides a visual indicator for tracking the average trend of five selected stocks. By calculating the exponential moving average (EMA) of the closing price of the five selected stocks, the indicator helps users quickly assess overall market sentiment. The indicator's original purpose was to inform the user of the direction of the five largest stocks that make up ~25% of the S&P 500.
Key Features:
- Custom Stock Selection: Choose any five stocks to monitor and visualize their combined trend.
- EMA-Based Trend: The indicator compares a fast and slow EMA to determine the direction of the trend. When the fast EMA is above the slow EMA, the trend is considered bullish (uptrend); otherwise, it's bearish (downtrend).
- Customizable Colors: You can easily customize the colors for both uptrends and downtrends, giving you control over the visual representation of the trend.
- Trend Bar Display: For an easy, sleek, and simple reference - The script displays a trend arrow in the lower-right corner of the chart for bullish momentum and a trend arrow in the top-right corner of the chart for bearish momentum.
This indicator is perfect for traders who want to monitor the combined movement of a group of major stocks in order to easily compare strengths or weaknesses. It is a key visual aid in understanding if the overall sentiment is bullish or bearish based on the selected stocks' performance, thus making sure the user is always trading on the right side of momentum.
보호된 스크립트입니다
이 스크립트는 비공개 소스로 게시됩니다. 하지만 이를 자유롭게 제한 없이 사용할 수 있습니다 – 자세한 내용은 여기에서 확인하세요.
- Jay -
KintsugiTrading@gmail.com
KintsugiTrading.com
KintsugiTrading@gmail.com
KintsugiTrading.com
면책사항
해당 정보와 게시물은 금융, 투자, 트레이딩 또는 기타 유형의 조언이나 권장 사항으로 간주되지 않으며, 트레이딩뷰에서 제공하거나 보증하는 것이 아닙니다. 자세한 내용은 이용 약관을 참조하세요.
보호된 스크립트입니다
이 스크립트는 비공개 소스로 게시됩니다. 하지만 이를 자유롭게 제한 없이 사용할 수 있습니다 – 자세한 내용은 여기에서 확인하세요.
- Jay -
KintsugiTrading@gmail.com
KintsugiTrading.com
KintsugiTrading@gmail.com
KintsugiTrading.com
면책사항
해당 정보와 게시물은 금융, 투자, 트레이딩 또는 기타 유형의 조언이나 권장 사항으로 간주되지 않으며, 트레이딩뷰에서 제공하거나 보증하는 것이 아닙니다. 자세한 내용은 이용 약관을 참조하세요.