OPEN-SOURCE SCRIPT
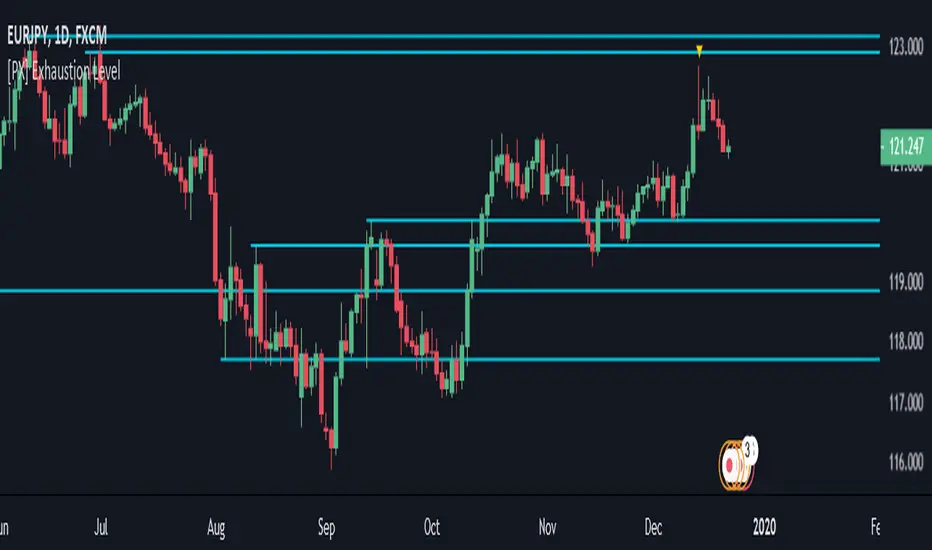
[PX] Exhaustion Level

Hello guys,
I love to play around with different methods for detecting support and resistance level. So today here is a new approach, which could be interesting to a few of you. I call it exhaustion level.
I'll give a brief introduction on how the indicator works and leave the testing/applying to you.
How does it work?
The method is basically very simple. The indicator constantly keeps track of the difference between the current close and the VWAP. The detected value will then be normalized and therefore put into comparison to it's previous "n" candles. (You decide yourself which value will be used for "n" by setting the "Length"-parameter in the settings tab.)
Once the normalized value equals "1", the price movement is considered to be somewhat overheated and the indicator starts plotting a level at the current high. The level will continually change until the movement goes the opposite way. Then it will settle and change its color.
The same approach takes place when the normalized value reaches "0", this time plotting a level at the low.
I hope some of you will find it useful and if so, please leave a "like" :)
Have fun, happy trading and merry Christmas :)))
오픈 소스 스크립트
트레이딩뷰의 진정한 정신에 따라, 이 스크립트의 작성자는 이를 오픈소스로 공개하여 트레이더들이 기능을 검토하고 검증할 수 있도록 했습니다. 작성자에게 찬사를 보냅니다! 이 코드는 무료로 사용할 수 있지만, 코드를 재게시하는 경우 하우스 룰이 적용된다는 점을 기억하세요.
🙋♂️Listed as "Trusted Pine Programmer for Hire"
💰Save $30 on your Tradingview subscription: bit.ly/3OtLyNz
🔓Indicator access: dize-trading.de/
🔒Trial access: discord.gg/DqwKjBZ8Qe
💰Save $30 on your Tradingview subscription: bit.ly/3OtLyNz
🔓Indicator access: dize-trading.de/
🔒Trial access: discord.gg/DqwKjBZ8Qe
면책사항
해당 정보와 게시물은 금융, 투자, 트레이딩 또는 기타 유형의 조언이나 권장 사항으로 간주되지 않으며, 트레이딩뷰에서 제공하거나 보증하는 것이 아닙니다. 자세한 내용은 이용 약관을 참조하세요.