PROTECTED SOURCE SCRIPT
업데이트됨 V2 Indicator: A Unique Indicator
V2 Indicator: A Unique Indicator Combining Percentage Level and 5MWAP
V2 Indicator is an innovative trading tool developed by Najoomi Ji. It incorporates a combination of percentage levels and the 5MWAP (5 Moving Weighted Average Price) to provide valuable insights into market trends. The concept of percentage chart trading was inspired by the late Gurbachan Singh, the father of Najoomi Ji.
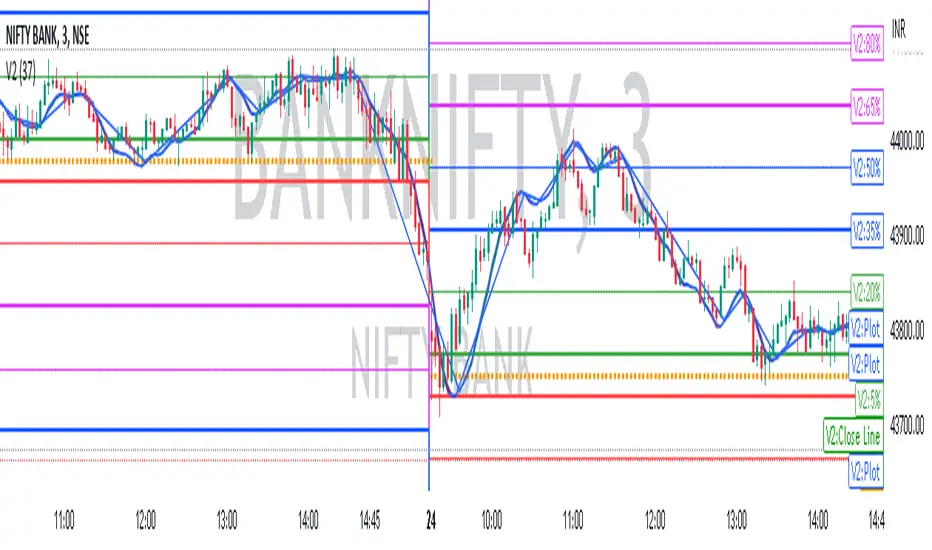
The primary rule of the V2 Indicator involves plotting lines on the chart based on the daily market open level and the percentage levels. At the start, a line is drawn 5% above and below the market open level on both sides. The indicator identifies the direction in which the market breaks out and prompts traders to enter the market accordingly.
To manage risk effectively, trailing stop-loss levels are employed in the V2 Indicator. These levels are set at significant percentage levels, such as 5%, 35%, 65%, and 95%. The market tends to respect these levels, making them crucial points for adjusting stop-loss orders.
Traders utilizing the V2 Indicator gain an advantage by closely monitoring the interplay between percentage levels and the 5MWAP. This indicator allows them to make informed decisions about market entry points, as well as effectively manage their trades by utilizing trailing stop-loss orders.
By combining the expertise of Najoomi Ji and the inspiration from Gurbachan Singh, the V2 Indicator offers a unique approach to trading, providing traders with a comprehensive tool for identifying market trends and managing risk effectively.
V2 Indicator is an innovative trading tool developed by Najoomi Ji. It incorporates a combination of percentage levels and the 5MWAP (5 Moving Weighted Average Price) to provide valuable insights into market trends. The concept of percentage chart trading was inspired by the late Gurbachan Singh, the father of Najoomi Ji.
The primary rule of the V2 Indicator involves plotting lines on the chart based on the daily market open level and the percentage levels. At the start, a line is drawn 5% above and below the market open level on both sides. The indicator identifies the direction in which the market breaks out and prompts traders to enter the market accordingly.
To manage risk effectively, trailing stop-loss levels are employed in the V2 Indicator. These levels are set at significant percentage levels, such as 5%, 35%, 65%, and 95%. The market tends to respect these levels, making them crucial points for adjusting stop-loss orders.
Traders utilizing the V2 Indicator gain an advantage by closely monitoring the interplay between percentage levels and the 5MWAP. This indicator allows them to make informed decisions about market entry points, as well as effectively manage their trades by utilizing trailing stop-loss orders.
By combining the expertise of Najoomi Ji and the inspiration from Gurbachan Singh, the V2 Indicator offers a unique approach to trading, providing traders with a comprehensive tool for identifying market trends and managing risk effectively.
릴리즈 노트
line color with changed for (dark screen) & 100% line added.릴리즈 노트
44 EMA COLOR CHANGE ADDED릴리즈 노트
trendline added with ema color changing modified 보호된 스크립트입니다
이 스크립트는 비공개 소스로 게시됩니다. 하지만 이를 자유롭게 제한 없이 사용할 수 있습니다 – 자세한 내용은 여기에서 확인하세요.
면책사항
해당 정보와 게시물은 금융, 투자, 트레이딩 또는 기타 유형의 조언이나 권장 사항으로 간주되지 않으며, 트레이딩뷰에서 제공하거나 보증하는 것이 아닙니다. 자세한 내용은 이용 약관을 참조하세요.
면책사항
해당 정보와 게시물은 금융, 투자, 트레이딩 또는 기타 유형의 조언이나 권장 사항으로 간주되지 않으며, 트레이딩뷰에서 제공하거나 보증하는 것이 아닙니다. 자세한 내용은 이용 약관을 참조하세요.