OPEN-SOURCE SCRIPT
업데이트됨 Heartbeat Momentum Strategy Beta
Heartbeat Momentum Strategy Beta
Overview
The Heartbeat Momentum Strategy is an innovative approach to market analysis that draws inspiration from the rhythmic patterns of a heartbeat. This strategy aims to identify significant momentum shifts in the market by comparing short-term and long-term moving averages, analogous to detecting irregularities in a heartbeat.
Key Concepts
Market Heartbeat: The difference between short-term and long-term moving averages, representing the market's current 'pulse'.
Heartbeat Volatility: Measured by the standard deviation of the market heartbeat.
Momentum Signals: Generated when the heartbeat deviates significantly from its normal range.
How It Works
Calculates a short-term moving average (default 5 periods) and a long-term moving average (default 20 periods) of the closing price.
Computes the 'heartbeat' by subtracting the long-term MA from the short-term MA.
Measures the volatility of the heartbeat using its standard deviation over the long-term period.
Generates buy signals when the heartbeat exceeds 2 standard deviations above its mean.
Generates sell signals when the heartbeat falls 2 standard deviations below its mean.
Indicator Components
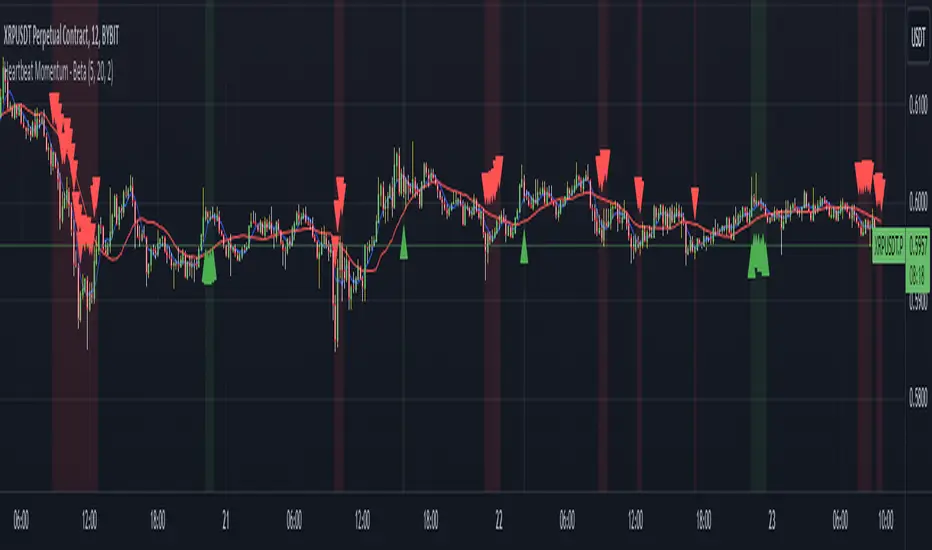
Blue Line: Short-term moving average
Red Line: Long-term moving average
Green Triangles: Buy signals
Red Triangles: Sell signals
Background Color: Light green during buy signals, light red during sell signals
Strategy Parameters
Short MA Window: The period for the short-term moving average (default: 5)
Long MA Window: The period for the long-term moving average (default: 20)
Standard Deviation Threshold: The number of standard deviations to trigger a signal (default: 2.0)
Interpretation
Buy Signal: Indicates a potential strong upward momentum shift. Consider opening long positions or closing short positions.
Sell Signal: Suggests a potential strong downward momentum shift. Consider opening short positions or closing long positions.
No Signal: The market is moving within its normal rhythm. Maintain current positions or look for other entry opportunities.
Customization
Users can adjust the strategy parameters to suit different assets, timeframes, or trading styles:
Decrease the MA windows for more frequent signals (more suitable for shorter timeframes).
Increase the MA windows for fewer, potentially more significant signals (better for longer timeframes).
Adjust the Standard Deviation Threshold to fine-tune sensitivity (lower for more signals, higher for fewer but potentially stronger signals).
Risk Management
While this strategy can provide valuable insights into market momentum, it should not be used in isolation:
Always use stop-loss orders to manage potential losses.
Consider the overall market context and other technical/fundamental factors.
Be aware of potential false signals, especially in ranging or highly volatile markets.
Backtest and forward-test the strategy with different parameters before live trading.
Conclusion
The Heartbeat Momentum Strategy offers a unique perspective on market movements by treating price action like a heartbeat. By identifying significant deviations from the normal market rhythm, it aims to capture strong momentum shifts while filtering out market noise. As with any trading strategy, use it as part of a comprehensive trading plan and always practice sound risk management.
Overview
The Heartbeat Momentum Strategy is an innovative approach to market analysis that draws inspiration from the rhythmic patterns of a heartbeat. This strategy aims to identify significant momentum shifts in the market by comparing short-term and long-term moving averages, analogous to detecting irregularities in a heartbeat.
Key Concepts
Market Heartbeat: The difference between short-term and long-term moving averages, representing the market's current 'pulse'.
Heartbeat Volatility: Measured by the standard deviation of the market heartbeat.
Momentum Signals: Generated when the heartbeat deviates significantly from its normal range.
How It Works
Calculates a short-term moving average (default 5 periods) and a long-term moving average (default 20 periods) of the closing price.
Computes the 'heartbeat' by subtracting the long-term MA from the short-term MA.
Measures the volatility of the heartbeat using its standard deviation over the long-term period.
Generates buy signals when the heartbeat exceeds 2 standard deviations above its mean.
Generates sell signals when the heartbeat falls 2 standard deviations below its mean.
Indicator Components
Blue Line: Short-term moving average
Red Line: Long-term moving average
Green Triangles: Buy signals
Red Triangles: Sell signals
Background Color: Light green during buy signals, light red during sell signals
Strategy Parameters
Short MA Window: The period for the short-term moving average (default: 5)
Long MA Window: The period for the long-term moving average (default: 20)
Standard Deviation Threshold: The number of standard deviations to trigger a signal (default: 2.0)
Interpretation
Buy Signal: Indicates a potential strong upward momentum shift. Consider opening long positions or closing short positions.
Sell Signal: Suggests a potential strong downward momentum shift. Consider opening short positions or closing long positions.
No Signal: The market is moving within its normal rhythm. Maintain current positions or look for other entry opportunities.
Customization
Users can adjust the strategy parameters to suit different assets, timeframes, or trading styles:
Decrease the MA windows for more frequent signals (more suitable for shorter timeframes).
Increase the MA windows for fewer, potentially more significant signals (better for longer timeframes).
Adjust the Standard Deviation Threshold to fine-tune sensitivity (lower for more signals, higher for fewer but potentially stronger signals).
Risk Management
While this strategy can provide valuable insights into market momentum, it should not be used in isolation:
Always use stop-loss orders to manage potential losses.
Consider the overall market context and other technical/fundamental factors.
Be aware of potential false signals, especially in ranging or highly volatile markets.
Backtest and forward-test the strategy with different parameters before live trading.
Conclusion
The Heartbeat Momentum Strategy offers a unique perspective on market movements by treating price action like a heartbeat. By identifying significant deviations from the normal market rhythm, it aims to capture strong momentum shifts while filtering out market noise. As with any trading strategy, use it as part of a comprehensive trading plan and always practice sound risk management.
릴리즈 노트
Heartbeat Momentum StrategyOverview
The Heartbeat Momentum Strategy is an innovative approach to market analysis that draws inspiration from the rhythmic patterns of a heartbeat. This strategy aims to identify significant momentum shifts in the market by comparing short-term and long-term moving averages, analogous to detecting irregularities in a heartbeat.
Key Concepts
Market Heartbeat: The difference between short-term and long-term moving averages, representing the market's current 'pulse'.
Heartbeat Volatility: Measured by the standard deviation of the market heartbeat.
Momentum Signals: Generated when the heartbeat deviates significantly from its normal range.
How It Works
Calculates a short-term moving average (default 5 periods) and a long-term moving average (default 20 periods) of the closing price.
Computes the 'heartbeat' by subtracting the long-term MA from the short-term MA.
Measures the volatility of the heartbeat using its standard deviation over the long-term period.
Generates buy signals when the heartbeat exceeds 2 standard deviations above its mean.
Generates sell signals when the heartbeat falls 2 standard deviations below its mean.
Indicator Components
Blue Line: Short-term moving average
Red Line: Long-term moving average
Green Triangles: Buy signals
Red Triangles: Sell signals
Background Color: Light green during buy signals, light red during sell signals
Strategy Parameters
Short MA Window: The period for the short-term moving average (default: 5)
Long MA Window: The period for the long-term moving average (default: 20)
Standard Deviation Threshold: The number of standard deviations to trigger a signal (default: 2.0)
Interpretation
Buy Signal: Indicates a potential strong upward momentum shift. Consider opening long positions or closing short positions.
Sell Signal: Suggests a potential strong downward momentum shift. Consider opening short positions or closing long positions.
No Signal: The market is moving within its normal rhythm. Maintain current positions or look for other entry opportunities.
Customization
Users can adjust the strategy parameters to suit different assets, timeframes, or trading styles:
Decrease the MA windows for more frequent signals (more suitable for shorter timeframes).
Increase the MA windows for fewer, potentially more significant signals (better for longer timeframes).
Adjust the Standard Deviation Threshold to fine-tune sensitivity (lower for more signals, higher for fewer but potentially stronger signals).
Risk Management
While this strategy can provide valuable insights into market momentum, it should not be used in isolation:
Always use stop-loss orders to manage potential losses.
Consider the overall market context and other technical/fundamental factors.
Be aware of potential false signals, especially in ranging or highly volatile markets.
Backtest and forward-test the strategy with different parameters before live trading.
Conclusion
The Heartbeat Momentum Strategy offers a unique perspective on market movements by treating price action like a heartbeat. By identifying significant deviations from the normal market rhythm, it aims to capture strong momentum shifts while filtering out market noise. As with any trading strategy, use it as part of a comprehensive trading plan and always practice sound risk management.
릴리즈 노트
Updating with new primary image that is on a naked chart.오픈 소스 스크립트
트레이딩뷰의 진정한 정신에 따라, 이 스크립트의 작성자는 이를 오픈소스로 공개하여 트레이더들이 기능을 검토하고 검증할 수 있도록 했습니다. 작성자에게 찬사를 보냅니다! 이 코드는 무료로 사용할 수 있지만, 코드를 재게시하는 경우 하우스 룰이 적용된다는 점을 기억하세요.
면책사항
해당 정보와 게시물은 금융, 투자, 트레이딩 또는 기타 유형의 조언이나 권장 사항으로 간주되지 않으며, 트레이딩뷰에서 제공하거나 보증하는 것이 아닙니다. 자세한 내용은 이용 약관을 참조하세요.
오픈 소스 스크립트
트레이딩뷰의 진정한 정신에 따라, 이 스크립트의 작성자는 이를 오픈소스로 공개하여 트레이더들이 기능을 검토하고 검증할 수 있도록 했습니다. 작성자에게 찬사를 보냅니다! 이 코드는 무료로 사용할 수 있지만, 코드를 재게시하는 경우 하우스 룰이 적용된다는 점을 기억하세요.
면책사항
해당 정보와 게시물은 금융, 투자, 트레이딩 또는 기타 유형의 조언이나 권장 사항으로 간주되지 않으며, 트레이딩뷰에서 제공하거나 보증하는 것이 아닙니다. 자세한 내용은 이용 약관을 참조하세요.