OPEN-SOURCE SCRIPT
업데이트됨 HTF Candle Boxes for LTF Charts
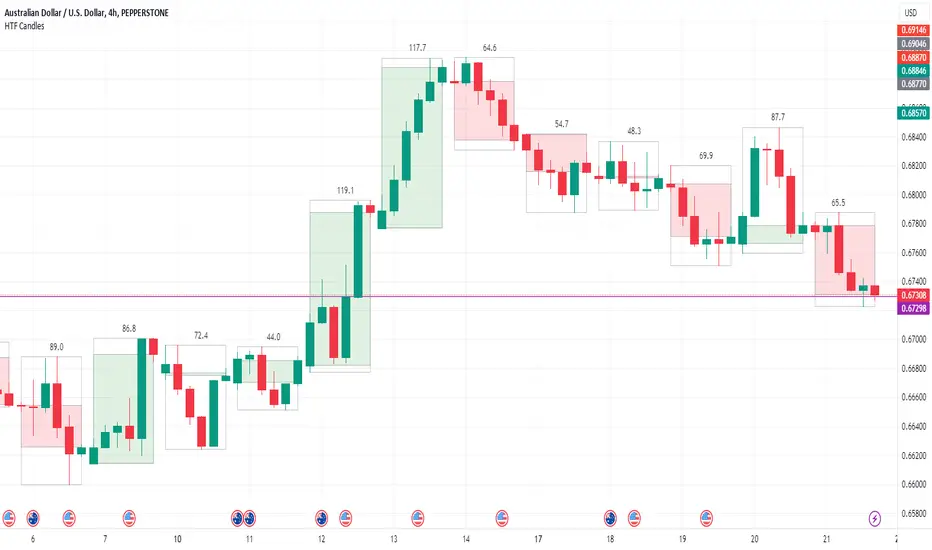
This indicator allows you to show an outline of a Higher Time Frame (HTF) candle on a Lower Time Frame (LTF) chart. Options include selecting the HTF interval, and an option to either show a single shaded Box for the candle (High to Low), or a shaded box for the body (Open to Close) with the High to Low shown in an unshaded box. The purpose is to easily visualise what the previous HTF candles look like as you are working on the lower charts, for example was yesterday's candle Bullish, Bearsish, indecision, a Doji etc.
릴리즈 노트
Added the option to not paint the current HTF bar, default is not 릴리즈 노트
This version cleans up the painting of the last candle as previously it would create multiple boxes on each new candle if in real-time. Also added is the optional inclusion to show the Pip-Range of the HTF candle.
릴리즈 노트
v4 10-Dec-23 - minor fix - occasionally the HTF box was paniting the wrong colour (for Doji-type Candles) because it was looking at the current candle rather than the last candle for that box. 릴리즈 노트
Version 5 - 26-Dec-24 Coverted to Pine V6, Fixed issues with the last candle update, added option for Mid-Line, reorganised the menu.
KNOWN ISSUE -- This does not work with non-divisble timeframes. The LTF candle open and close dictates the HTF data. For example a 2min chart with a 5min HTF. Because the M5 changes halfway through a M2 candle, you will end up with a series of 2 bar then 3 bar HTF candles. Simarly a weekly chart with a Monthly HTF because a month may end mid-week (not divisible)
오픈 소스 스크립트
진정한 트레이딩뷰 정신에 따라 이 스크립트 작성자는 트레이더가 기능을 검토하고 검증할 수 있도록 오픈소스로 공개했습니다. 작성자에게 찬사를 보냅니다! 무료로 사용할 수 있지만 코드를 다시 게시할 경우 하우스 룰이 적용된다는 점을 기억하세요.
면책사항
이 정보와 게시물은 TradingView에서 제공하거나 보증하는 금융, 투자, 거래 또는 기타 유형의 조언이나 권고 사항을 의미하거나 구성하지 않습니다. 자세한 내용은 이용 약관을 참고하세요.
오픈 소스 스크립트
진정한 트레이딩뷰 정신에 따라 이 스크립트 작성자는 트레이더가 기능을 검토하고 검증할 수 있도록 오픈소스로 공개했습니다. 작성자에게 찬사를 보냅니다! 무료로 사용할 수 있지만 코드를 다시 게시할 경우 하우스 룰이 적용된다는 점을 기억하세요.
면책사항
이 정보와 게시물은 TradingView에서 제공하거나 보증하는 금융, 투자, 거래 또는 기타 유형의 조언이나 권고 사항을 의미하거나 구성하지 않습니다. 자세한 내용은 이용 약관을 참고하세요.