PROTECTED SOURCE SCRIPT
업데이트됨 ILM India Sectors NSDL FII/FPI Investments Fortnightly
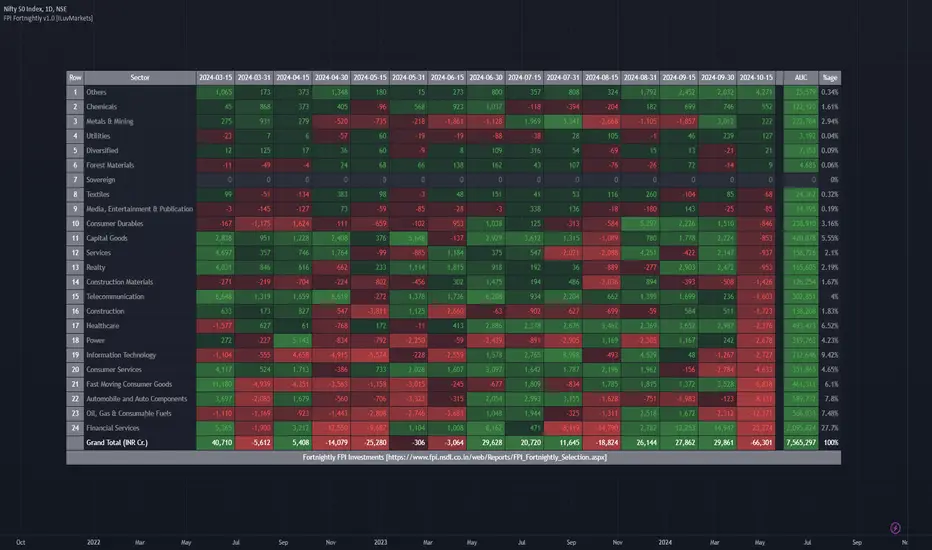
This indicator shows the FII/FPI fortnightly investments across various sectors for easy consumption.
This data is sourced from website
fpi.nsdl.co.in/web/Reports/FPI_Fortnightly_Selection.aspx
This data gets published on a fortnightly basis.
This data is very difficult to interpret and not easy to consume.
This indicator makes this data very easy to consume and make good investment decisions by tagging along with Smart Money.
Since Trading View does not expose this data via QUANDL or any other means, the data is updated in the indicator itself.
Hence, indicator needs to be updated as soon as the new data is available on a fortnightly basis.
All the numbers are in INR Cr.
The date columns represent the investment value for that fortnight for the sector
AUC column represents the total Assets held by FPI in that sector
%age column represents the %age of Assets in the sector compared to Total FPI investment
Features Planned in future
- Drill down to Group-A stocks in the sector and show the performance of the stock (% Change, Volume, Delivery) fortnightly so specific stock can be identified
Send me a DM if you would like to see any additional features on this indicator
릴리즈 노트
Better screenshot릴리즈 노트
- Updated data for Nov 30th, 2022
릴리즈 노트
- Updated data for 2022-12-15
릴리즈 노트
- Updated for Dec 31, 2022
릴리즈 노트
Updated data for Jan 15, 2023릴리즈 노트
- Fixed row number
릴리즈 노트
- Fixed row numbers
릴리즈 노트
Data update for Jan 31, 2023릴리즈 노트
Updated for Feb 15, 2023릴리즈 노트
Updated data for Feb 28, 2023릴리즈 노트
Added data for Mar 15, 2023릴리즈 노트
Fix릴리즈 노트
Fixed Row#릴리즈 노트
Updated data for Mar 31, 2023릴리즈 노트
Updated until Jul 31st 2023릴리즈 노트
Updated data until Sep 15th, 2023릴리즈 노트
Fixed Row#릴리즈 노트
Updated data for Sep 30, 2023릴리즈 노트
Update for Oct, 2023릴리즈 노트
Updated data for Nov 2023릴리즈 노트
Added data for Dec 15, 2023릴리즈 노트
Updated till 2024-01-19릴리즈 노트
Updated till Jan 31st, 2024릴리즈 노트
Updated for Feb, 2024릴리즈 노트
Updated for Mar 15, 2024릴리즈 노트
Updated for Apr 4, 2024릴리즈 노트
Updated for Apr 15, 2024릴리즈 노트
Updated till May 15, 2024릴리즈 노트
Updated till May 31, 2024릴리즈 노트
Updated for Jun 2024릴리즈 노트
Updated for July 2024릴리즈 노트
Update for Aug 15, 2024릴리즈 노트
Update till Oct 15, 2024보호된 스크립트입니다
이 스크립트는 비공개 소스로 게시됩니다. 하지만 이를 자유롭게 제한 없이 사용할 수 있습니다 – 자세한 내용은 여기에서 확인하세요.
면책사항
해당 정보와 게시물은 금융, 투자, 트레이딩 또는 기타 유형의 조언이나 권장 사항으로 간주되지 않으며, 트레이딩뷰에서 제공하거나 보증하는 것이 아닙니다. 자세한 내용은 이용 약관을 참조하세요.
보호된 스크립트입니다
이 스크립트는 비공개 소스로 게시됩니다. 하지만 이를 자유롭게 제한 없이 사용할 수 있습니다 – 자세한 내용은 여기에서 확인하세요.
면책사항
해당 정보와 게시물은 금융, 투자, 트레이딩 또는 기타 유형의 조언이나 권장 사항으로 간주되지 않으며, 트레이딩뷰에서 제공하거나 보증하는 것이 아닙니다. 자세한 내용은 이용 약관을 참조하세요.