OPEN-SOURCE SCRIPT
Price Action Health Check

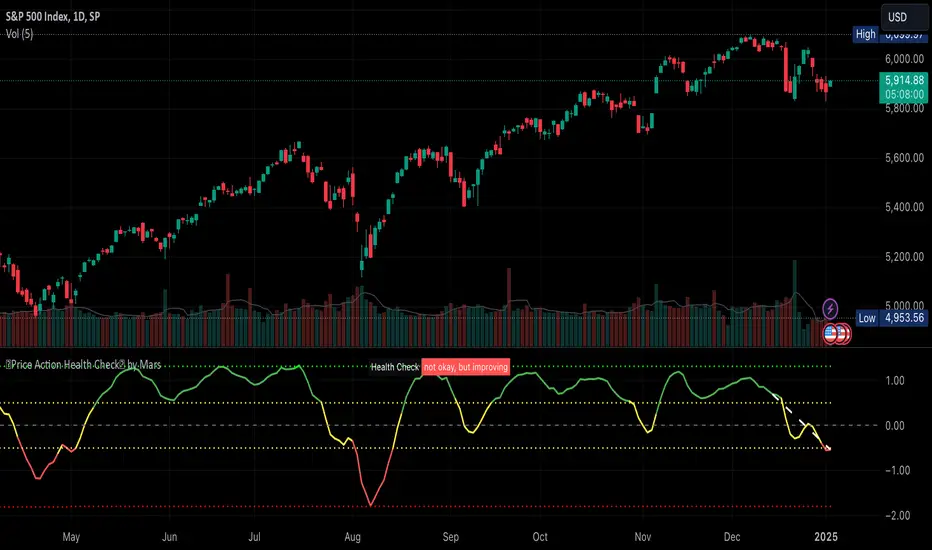
This is a price action indicator that measures market health by comparing EMAs, adapting automatically to different timeframes (Weekly/Daily more reliable) and providing context-aware health status.
Key features:
Trading applications:
I like to use it to keep SPX in check before deciding the market is going down.
Note: For optimal analysis, use primarily on Weekly and Daily timeframes where price action patterns are more significant.
Key features:
- Automatically adjusts EMA periods based on timeframe
- Measures price action health through EMA separation and historical context
- Provides visual health status with clear improvement/deterioration signals
- Projects a 13-period trend line for directional context
Trading applications:
- Identify shifts in market health before major trend changes
- Validate trend strength by comparing current readings to historical averages
- Time entries/exits based on health status transitions
- Filter trades using timeframe-specific health readings
I like to use it to keep SPX in check before deciding the market is going down.
Note: For optimal analysis, use primarily on Weekly and Daily timeframes where price action patterns are more significant.
오픈 소스 스크립트
트레이딩뷰의 진정한 정신에 따라, 이 스크립트의 작성자는 이를 오픈소스로 공개하여 트레이더들이 기능을 검토하고 검증할 수 있도록 했습니다. 작성자에게 찬사를 보냅니다! 이 코드는 무료로 사용할 수 있지만, 코드를 재게시하는 경우 하우스 룰이 적용된다는 점을 기억하세요.
Cyclist, Trader, Technologist. Get access to data for my options indicators on smartcanvas.com for free via bots
면책사항
해당 정보와 게시물은 금융, 투자, 트레이딩 또는 기타 유형의 조언이나 권장 사항으로 간주되지 않으며, 트레이딩뷰에서 제공하거나 보증하는 것이 아닙니다. 자세한 내용은 이용 약관을 참조하세요.