OPEN-SOURCE SCRIPT
업데이트됨 Exponential Regression
In Tradingview it is not possible to actually display arbitrary non-linear functions retrospectively.
Series objects can only depend on the current or past bars
Thus, while regression is possible, display of a non-linear curve into the past is not possible
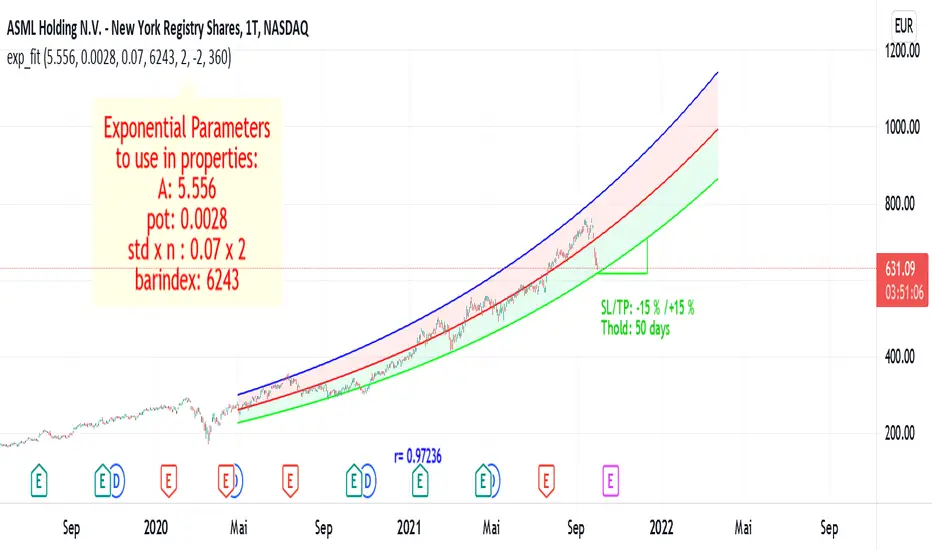
This script is a workaround to be able to still display an exponential fit of the last n bars.
It is based on a linear regression of the log(close). The parameters of this regression are printed in the label.
To create the correct plot, these parameters have to be written into the properties of the indicator.
The functions displayed follow the expression exp(A)* exp(pot*t+d)
where d =0 for the center line, and d = +-std * upperMult for the upper and lower line respectiveley.
The parameters of the function are:
This code is a version of the built-in "linear regression" script of Tradingview alztered by Forza so it can be plotted correctly on logarithmic charts
The code of Forza was further adjusted by altustro to be able to plot the full exponential curve also in regular scale
Series objects can only depend on the current or past bars
Thus, while regression is possible, display of a non-linear curve into the past is not possible
This script is a workaround to be able to still display an exponential fit of the last n bars.
It is based on a linear regression of the log(close). The parameters of this regression are printed in the label.
To create the correct plot, these parameters have to be written into the properties of the indicator.
The functions displayed follow the expression exp(A)* exp(pot*t+d)
where d =0 for the center line, and d = +-std * upperMult for the upper and lower line respectiveley.
The parameters of the function are:
- amplitude in log scale A
- exponent of the exponential function pot
- standard deviation of the linear regression std
- number of bars of the current chart bindex
- multiplicator of the std of the upper and lower exponential line upperMult and lowerMult +
This code is a version of the built-in "linear regression" script of Tradingview alztered by Forza so it can be plotted correctly on logarithmic charts
The code of Forza was further adjusted by altustro to be able to plot the full exponential curve also in regular scale
릴리즈 노트
removed other indicators to give clear view.moved stop loss (SL) / take profit (TP) and holding time tHold a little lower for better view
릴리즈 노트
removed other indicators in chart릴리즈 노트
renamed and default length now 360오픈 소스 스크립트
트레이딩뷰의 진정한 정신에 따라, 이 스크립트의 작성자는 이를 오픈소스로 공개하여 트레이더들이 기능을 검토하고 검증할 수 있도록 했습니다. 작성자에게 찬사를 보냅니다! 이 코드는 무료로 사용할 수 있지만, 코드를 재게시하는 경우 하우스 룰이 적용된다는 점을 기억하세요.
면책사항
해당 정보와 게시물은 금융, 투자, 트레이딩 또는 기타 유형의 조언이나 권장 사항으로 간주되지 않으며, 트레이딩뷰에서 제공하거나 보증하는 것이 아닙니다. 자세한 내용은 이용 약관을 참조하세요.
오픈 소스 스크립트
트레이딩뷰의 진정한 정신에 따라, 이 스크립트의 작성자는 이를 오픈소스로 공개하여 트레이더들이 기능을 검토하고 검증할 수 있도록 했습니다. 작성자에게 찬사를 보냅니다! 이 코드는 무료로 사용할 수 있지만, 코드를 재게시하는 경우 하우스 룰이 적용된다는 점을 기억하세요.
면책사항
해당 정보와 게시물은 금융, 투자, 트레이딩 또는 기타 유형의 조언이나 권장 사항으로 간주되지 않으며, 트레이딩뷰에서 제공하거나 보증하는 것이 아닙니다. 자세한 내용은 이용 약관을 참조하세요.