INVITE-ONLY SCRIPT
EMA based Candle Coloring
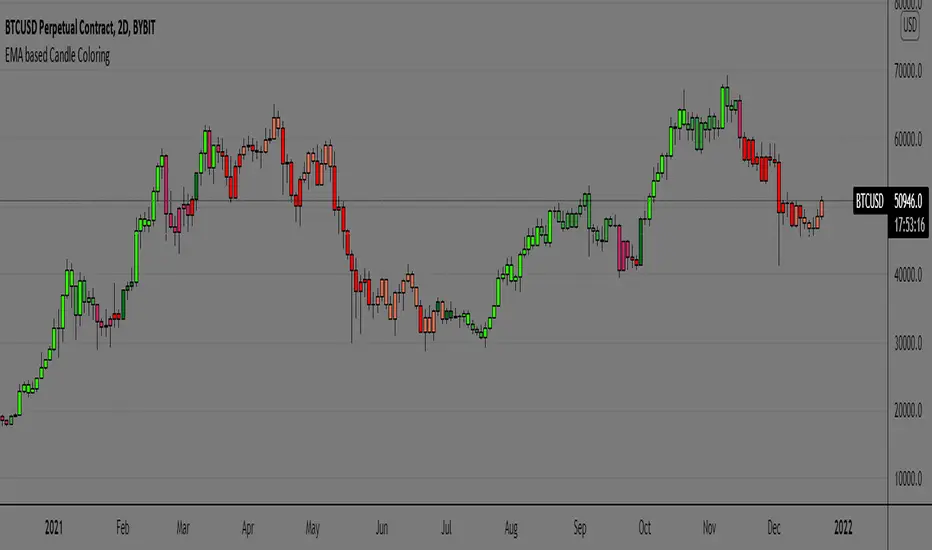
EMA or Exponential Moving Average (EMA) is a technical indicator used in trading practices that shows how the price of an asset or security changes over a certain period of time. The EMA is different from a simple moving average in that it places more weight on recent data points (i.e., recent prices)
In this script plain EMA or MA is not used for candle coloring, but it takes multiple EMAs of the original EMA and then subtracts lag from the result to get data points of each candle of two certain periods defined. As it differs from traditional EMAs and MAs by reacting quicker to price changes and is able to subtract lag with its calculated formula.
The candle coloring is able to interpret short-term price direction and overall trend and its suitable for active traders. As it tracks price more closely than SMAs
Since EMAs can also provide support or resistance for price and is highly reliant on the asset’s lookback period we can make sure we stay with the trend rather than going against the trend.
*First of all here's what the colors represent and how to interpret them is shown in below image

Examples of how I use the Coloring pattern
Spotting a fakeout/stophunt

during trends:

* No strategy is 100% accurate this script is one of those too , traders must use this as an addition to their system rather than making it a standalone system.
* Context is important as the coloring is done using calculations, different timeframes has different context hence traders discretion is key.
Hope you find this helpful,
Thankyou.
happy trading.
In this script plain EMA or MA is not used for candle coloring, but it takes multiple EMAs of the original EMA and then subtracts lag from the result to get data points of each candle of two certain periods defined. As it differs from traditional EMAs and MAs by reacting quicker to price changes and is able to subtract lag with its calculated formula.
The candle coloring is able to interpret short-term price direction and overall trend and its suitable for active traders. As it tracks price more closely than SMAs
Since EMAs can also provide support or resistance for price and is highly reliant on the asset’s lookback period we can make sure we stay with the trend rather than going against the trend.
*First of all here's what the colors represent and how to interpret them is shown in below image
Examples of how I use the Coloring pattern
Spotting a fakeout/stophunt
during trends:
* No strategy is 100% accurate this script is one of those too , traders must use this as an addition to their system rather than making it a standalone system.
* Context is important as the coloring is done using calculations, different timeframes has different context hence traders discretion is key.
Hope you find this helpful,
Thankyou.
happy trading.
초대 전용 스크립트
이 스크립트는 작성자가 승인한 사용자만 접근할 수 있습니다. 사용하려면 요청 후 승인을 받아야 하며, 일반적으로 결제 후에 허가가 부여됩니다. 자세한 내용은 아래 작성자의 안내를 따르거나 buckham_에게 직접 문의하세요.
트레이딩뷰는 스크립트의 작동 방식을 충분히 이해하고 작성자를 완전히 신뢰하지 않는 이상, 해당 스크립트에 비용을 지불하거나 사용하는 것을 권장하지 않습니다. 커뮤니티 스크립트에서 무료 오픈소스 대안을 찾아보실 수도 있습니다.
작성자 지시 사항
one can PM in Tradingview or via twitter mentioned in signature/profile. Thanks
면책사항
해당 정보와 게시물은 금융, 투자, 트레이딩 또는 기타 유형의 조언이나 권장 사항으로 간주되지 않으며, 트레이딩뷰에서 제공하거나 보증하는 것이 아닙니다. 자세한 내용은 이용 약관을 참조하세요.