OPEN-SOURCE SCRIPT
Simple Parallel Channel Tracker
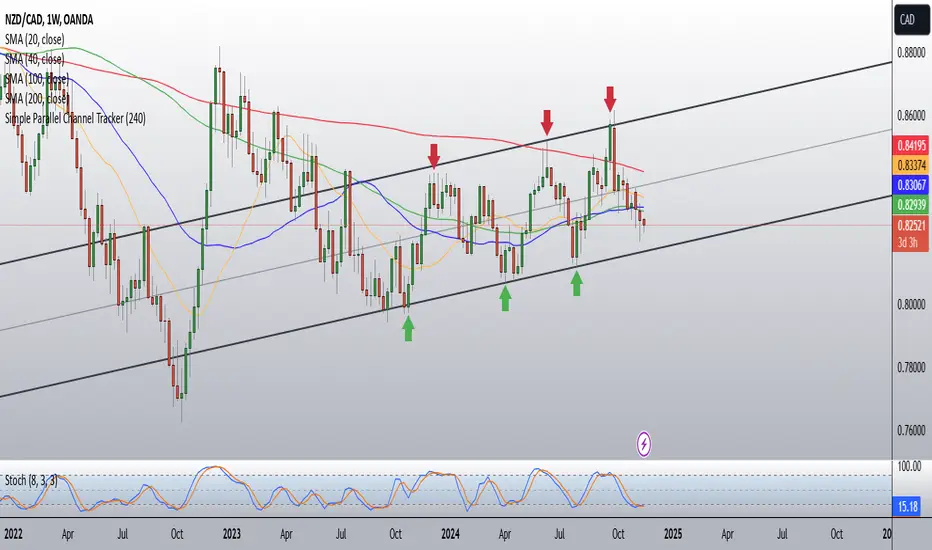
This script will automatically draw price channels with two parallel trends lines, the upper trendline and lower trendline. These lines can be changed in terms of appearance at any time.
The Script takes in fractals from local and historic price action points and connects them over a certain period or amount of candles as inputted by the user. It tracks the most recent highs and lows formed and uses this data to determine where the channel begins.
The Script will decide whether to use the most recent high, or low, depending on what comes first.
Why is this useful?
Often, Traders either have no trend lines on their charts, or they draw them incorrectly. Whichever category a trader falls into, there can only be benefits from having Trend lines and Parallel Channels drawn automatically.
Trends naturally occur in all Markets, all the time. These oscillations when tracked allow for a more reliable following of Markets and management of Market cycles.
오픈 소스 스크립트
트레이딩뷰의 진정한 정신에 따라, 이 스크립트의 작성자는 이를 오픈소스로 공개하여 트레이더들이 기능을 검토하고 검증할 수 있도록 했습니다. 작성자에게 찬사를 보냅니다! 이 코드는 무료로 사용할 수 있지만, 코드를 재게시하는 경우 하우스 룰이 적용된다는 점을 기억하세요.
Free Pro Multi Asset Trading Guide:
bit.ly/learnttm
Free Discord Secret Server:
discord.gg/tXAcxFVCJU
Posts Not financial advice.
bit.ly/learnttm
Free Discord Secret Server:
discord.gg/tXAcxFVCJU
Posts Not financial advice.
면책사항
해당 정보와 게시물은 금융, 투자, 트레이딩 또는 기타 유형의 조언이나 권장 사항으로 간주되지 않으며, 트레이딩뷰에서 제공하거나 보증하는 것이 아닙니다. 자세한 내용은 이용 약관을 참조하세요.