OPEN-SOURCE SCRIPT
업데이트됨 Ultra Trendlines
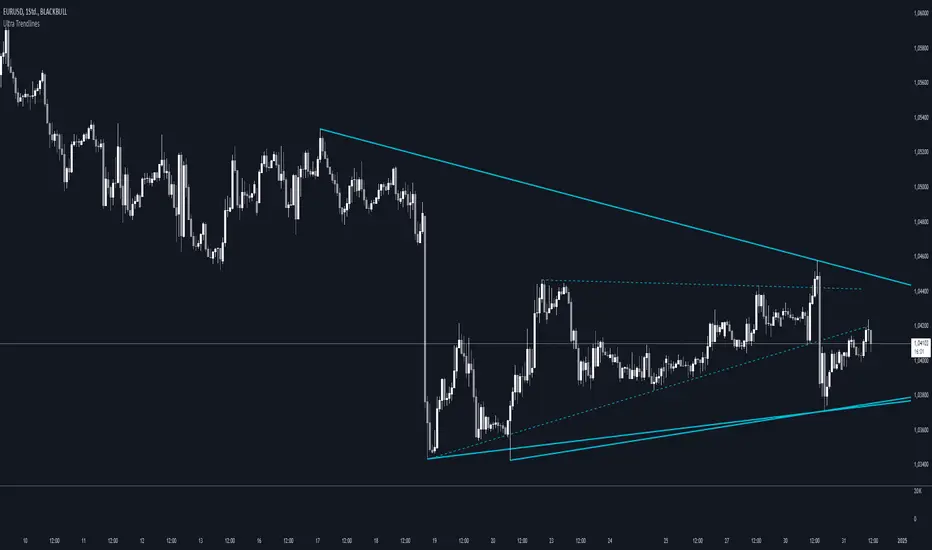
This indicator automatically draws trendlines based on every pivot point, helping traders visualize key support and resistance levels. It dynamically adjusts as new pivots are detected and validates the trendlines against price movement.
Introduction
The Ultra Trendlines indicator is designed to help traders identify and track significant trendlines on their charts. By automatically detecting pivot points (both highs and lows), it draws trendlines that highlight key market movements. These trendlines are valuable for understanding the broader trend and for making informed trading decisions.
Detailed Description
The indicator analyzes price data to find pivot points highs and lows over a user-defined lookback period. Once a pivot is detected, it draws trendlines between the pivot points.
.........
.........
Summary of Key Points
The indicator automatically detects pivot points (highs and lows) and draws trendlines based on them. It allows you to customize the style, color, and width of the trendlines. The indicator filters out invalid trendlines by checking if they are still relevant based on price action and price thresholds. Additionally, you can choose to only display rising lows and falling highs for more accurate trend analysis. It also removes outdated trendlines to keep the chart clean.
Introduction
The Ultra Trendlines indicator is designed to help traders identify and track significant trendlines on their charts. By automatically detecting pivot points (both highs and lows), it draws trendlines that highlight key market movements. These trendlines are valuable for understanding the broader trend and for making informed trading decisions.
Detailed Description
The indicator analyzes price data to find pivot points highs and lows over a user-defined lookback period. Once a pivot is detected, it draws trendlines between the pivot points.
.........
- Accuracy
To ensure accuracy, the indicator only keeps trendlines that are confirmed by price action. It checks if the price crosses the trendline and deletes invalid lines.
Additionally, it checks if the trendlines stay within predefined price thresholds, filtering out irrelevant lines that are too far from current price action.
The indicator also has an option to only show "rising lows" and "falling highs" trendlines, offering further precision in trend direction.
As new pivots are detected, older trendlines that fall outside the lookback period are removed, ensuring the chart remains clean.
..... - Style
The trendlines can extend forward (infinite and userdefined), backward, both or none. The lines are drawn with a customizable style (solid, dotted, or dashed), color, and width.
.........
Summary of Key Points
The indicator automatically detects pivot points (highs and lows) and draws trendlines based on them. It allows you to customize the style, color, and width of the trendlines. The indicator filters out invalid trendlines by checking if they are still relevant based on price action and price thresholds. Additionally, you can choose to only display rising lows and falling highs for more accurate trend analysis. It also removes outdated trendlines to keep the chart clean.
릴리즈 노트
updated the script logic where trendlines will be deleted and added an option to display last X broken trendlines in desired settings.Broken Trendlines are not affected by Lookback!!
릴리즈 노트
added a new filter for trendlines릴리즈 노트
added user inputs for filtering trendlines오픈 소스 스크립트
트레이딩뷰의 진정한 정신에 따라, 이 스크립트의 작성자는 이를 오픈소스로 공개하여 트레이더들이 기능을 검토하고 검증할 수 있도록 했습니다. 작성자에게 찬사를 보냅니다! 이 코드는 무료로 사용할 수 있지만, 코드를 재게시하는 경우 하우스 룰이 적용된다는 점을 기억하세요.
면책사항
해당 정보와 게시물은 금융, 투자, 트레이딩 또는 기타 유형의 조언이나 권장 사항으로 간주되지 않으며, 트레이딩뷰에서 제공하거나 보증하는 것이 아닙니다. 자세한 내용은 이용 약관을 참조하세요.
오픈 소스 스크립트
트레이딩뷰의 진정한 정신에 따라, 이 스크립트의 작성자는 이를 오픈소스로 공개하여 트레이더들이 기능을 검토하고 검증할 수 있도록 했습니다. 작성자에게 찬사를 보냅니다! 이 코드는 무료로 사용할 수 있지만, 코드를 재게시하는 경우 하우스 룰이 적용된다는 점을 기억하세요.
면책사항
해당 정보와 게시물은 금융, 투자, 트레이딩 또는 기타 유형의 조언이나 권장 사항으로 간주되지 않으며, 트레이딩뷰에서 제공하거나 보증하는 것이 아닙니다. 자세한 내용은 이용 약관을 참조하세요.