OPEN-SOURCE SCRIPT
Madrid Trend Trading
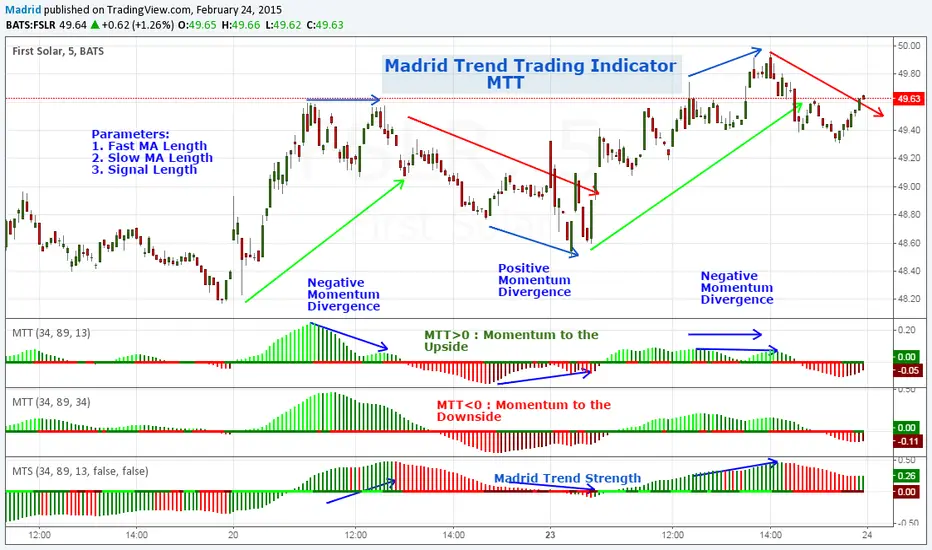
Madrid Trend Trading is an indicator that shows Momentum direction and strength based on a given trend (pair of MA's). It is useful to detect the direction of the trend, Momentum divergences with the trend and possible trend reversals.
Parameters
1. Fast MA Length
2. Slow MA Length
3. Signal Length
Trading with MTT
1. MTT > 0 and increasing (Lime) : Long position
2. MTT > 0 and decreasing (Green) : entry/exit long position, take profits or plan an entry
3. MTT < 0 and decreasing (Red) : Short position
4. MTT <0 and increasing (Maroon) : entry/exit short position, take profits or plan entry
This shows the market waves, it's a good indicator for swing trading since it shows the change of direction of the trend, signals profit areas and entry/exit regions. Change in the direction of the trend can be spotted by the cross over the zero line or by trend divergences, H-H in the trend and L-H in the MTT indicator means a downtrend is close. L-L in the trend and H-L in the indicator means an uptrend is forming.
There is a bar in the zero line that shows the momentum direction, simple, green it's increasing, red, it's decreasing.
This indicator is meant to be a companion of the MTS indicator. When combined MTS shows the direction and strength of the trend, meanwhile MTT shows if the trend is weakening, gaining strength, confirms continuation or warns a reversal.
What I look from my indicators is to create a tool that filters out as much noise as possible without losing much sensitivity, they have to be easy to tune and simple to analyze, so I normally use contrasting colors, using cold colors for long positions and warm colors for short positions. I try to use the least possible number of parameters and the defaults have been set after several months of testing in Beta mode against hundreds of charts before publishing them.
I hope this effort can help you to have a simpler point of view of the market.
오픈 소스 스크립트
트레이딩뷰의 진정한 정신에 따라, 이 스크립트의 작성자는 이를 오픈소스로 공개하여 트레이더들이 기능을 검토하고 검증할 수 있도록 했습니다. 작성자에게 찬사를 보냅니다! 이 코드는 무료로 사용할 수 있지만, 코드를 재게시하는 경우 하우스 룰이 적용된다는 점을 기억하세요.
면책사항
해당 정보와 게시물은 금융, 투자, 트레이딩 또는 기타 유형의 조언이나 권장 사항으로 간주되지 않으며, 트레이딩뷰에서 제공하거나 보증하는 것이 아닙니다. 자세한 내용은 이용 약관을 참조하세요.
오픈 소스 스크립트
트레이딩뷰의 진정한 정신에 따라, 이 스크립트의 작성자는 이를 오픈소스로 공개하여 트레이더들이 기능을 검토하고 검증할 수 있도록 했습니다. 작성자에게 찬사를 보냅니다! 이 코드는 무료로 사용할 수 있지만, 코드를 재게시하는 경우 하우스 룰이 적용된다는 점을 기억하세요.
면책사항
해당 정보와 게시물은 금융, 투자, 트레이딩 또는 기타 유형의 조언이나 권장 사항으로 간주되지 않으며, 트레이딩뷰에서 제공하거나 보증하는 것이 아닙니다. 자세한 내용은 이용 약관을 참조하세요.