OPEN-SOURCE SCRIPT
Jackson Hole Meetings - Lines and Labels
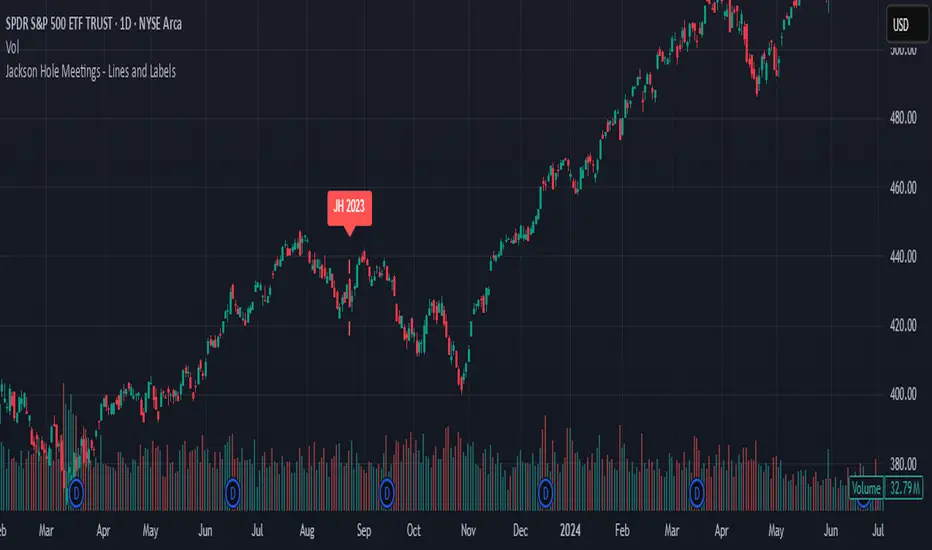
This TradingView Pine Script indicator marks the dates of the Federal Reserve’s annual Jackson Hole Economic Symposium meetings on your chart. For each meeting date from 2020 through 2025, it draws a red dashed vertical line directly on the corresponding daily bar. Additionally, it places a label above the bar indicating the year of the meeting (e.g., "JH 2025").
Features:
Marks all known Jackson Hole meeting dates from 2020 to 2025.
Draws a vertical dashed line on each meeting day for clear visual identification.
Displays a label above the candle with the meeting year.
Works best on daily timeframe charts.
Helps traders quickly spot potential market-moving events related to Jackson Hole meetings.
Use this tool to visually correlate price action with these key Federal Reserve events and enhance your trading analysis.
오픈 소스 스크립트
트레이딩뷰의 진정한 정신에 따라, 이 스크립트의 작성자는 이를 오픈소스로 공개하여 트레이더들이 기능을 검토하고 검증할 수 있도록 했습니다. 작성자에게 찬사를 보냅니다! 이 코드는 무료로 사용할 수 있지만, 코드를 재게시하는 경우 하우스 룰이 적용된다는 점을 기억하세요.
면책사항
해당 정보와 게시물은 금융, 투자, 트레이딩 또는 기타 유형의 조언이나 권장 사항으로 간주되지 않으며, 트레이딩뷰에서 제공하거나 보증하는 것이 아닙니다. 자세한 내용은 이용 약관을 참조하세요.
오픈 소스 스크립트
트레이딩뷰의 진정한 정신에 따라, 이 스크립트의 작성자는 이를 오픈소스로 공개하여 트레이더들이 기능을 검토하고 검증할 수 있도록 했습니다. 작성자에게 찬사를 보냅니다! 이 코드는 무료로 사용할 수 있지만, 코드를 재게시하는 경우 하우스 룰이 적용된다는 점을 기억하세요.
면책사항
해당 정보와 게시물은 금융, 투자, 트레이딩 또는 기타 유형의 조언이나 권장 사항으로 간주되지 않으며, 트레이딩뷰에서 제공하거나 보증하는 것이 아닙니다. 자세한 내용은 이용 약관을 참조하세요.