OPEN-SOURCE SCRIPT
CHK 3TIMEFRAME RSI OB-OS SCREENER
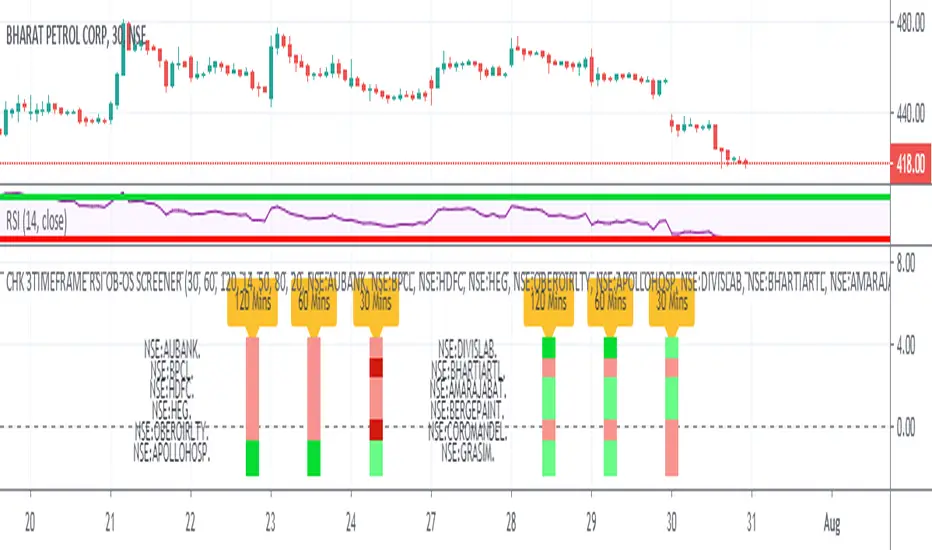
Sharing RSI Screener. It shows RSI Situation for 12 Stocks.
User can replace the stocks as per their respective exchange
User can select 3 Time Frames of his/her choice
User can change the OverBought / OverSold Values to 70/30. This indicator uses 80/20.
RSI BELOW 50 = PINK COLOR
OVERSOLD = MAROON COLOR
RSI ABOVE 50 = LIGHT GREEN COLOR
OVERBOUGHT = DARK GREEN COLOR
For Example : This Chart and the Indicator snapshot shows, the stock BPCL is Oversold for the 30 Min TimeFrame
For Example : The indicator snapshot shows, the stocks HDFC and AUBANK have their RSI's below 50 across the 30 Min / 60 Min / 120 Min
TimeFrames
Please give it some time to load, and every time you change Resolution.
Add another one, to have a screener screening 24 stocks :)
오픈 소스 스크립트
트레이딩뷰의 진정한 정신에 따라, 이 스크립트의 작성자는 이를 오픈소스로 공개하여 트레이더들이 기능을 검토하고 검증할 수 있도록 했습니다. 작성자에게 찬사를 보냅니다! 이 코드는 무료로 사용할 수 있지만, 코드를 재게시하는 경우 하우스 룰이 적용된다는 점을 기억하세요.
면책사항
해당 정보와 게시물은 금융, 투자, 트레이딩 또는 기타 유형의 조언이나 권장 사항으로 간주되지 않으며, 트레이딩뷰에서 제공하거나 보증하는 것이 아닙니다. 자세한 내용은 이용 약관을 참조하세요.
오픈 소스 스크립트
트레이딩뷰의 진정한 정신에 따라, 이 스크립트의 작성자는 이를 오픈소스로 공개하여 트레이더들이 기능을 검토하고 검증할 수 있도록 했습니다. 작성자에게 찬사를 보냅니다! 이 코드는 무료로 사용할 수 있지만, 코드를 재게시하는 경우 하우스 룰이 적용된다는 점을 기억하세요.
면책사항
해당 정보와 게시물은 금융, 투자, 트레이딩 또는 기타 유형의 조언이나 권장 사항으로 간주되지 않으며, 트레이딩뷰에서 제공하거나 보증하는 것이 아닙니다. 자세한 내용은 이용 약관을 참조하세요.