PROTECTED SOURCE SCRIPT
9, 21, 50 EMA TN
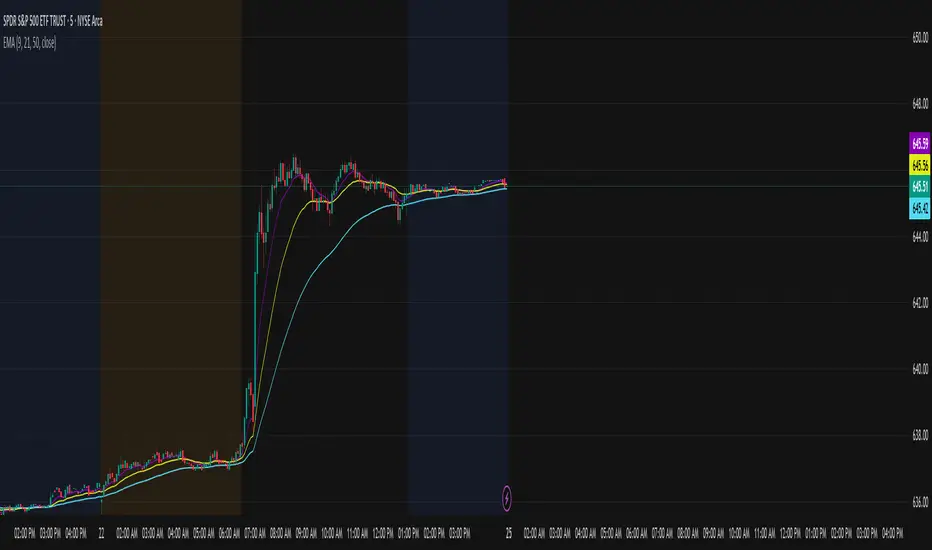
This indicator plots three exponential moving averages (EMAs) on the chart:
9 EMA (purple) – short-term trend and momentum
21 EMA (yellow) – medium-term trend
50 EMA (cyan) – long-term trend and overall market direction
How it’s used:
Traders look for the 9 EMA to cross above the 21 EMA as a potential bullish signal. This suggests upward momentum and may be used as confirmation for call entries.
Conversely, when the 9 EMA crosses below the 21 EMA, it can indicate bearish momentum, often used as confirmation for put entries.
The 50 EMA acts as a higher timeframe filter: when price and the shorter EMAs are above the 50 EMA, it confirms bullish bias; when they’re below, it confirms bearish bias.
This tool helps identify short-term momentum shifts while staying aligned with the larger market trend.
보호된 스크립트입니다
이 스크립트는 비공개 소스로 게시됩니다. 하지만 이를 자유롭게 제한 없이 사용할 수 있습니다 – 자세한 내용은 여기에서 확인하세요.
면책사항
해당 정보와 게시물은 금융, 투자, 트레이딩 또는 기타 유형의 조언이나 권장 사항으로 간주되지 않으며, 트레이딩뷰에서 제공하거나 보증하는 것이 아닙니다. 자세한 내용은 이용 약관을 참조하세요.
보호된 스크립트입니다
이 스크립트는 비공개 소스로 게시됩니다. 하지만 이를 자유롭게 제한 없이 사용할 수 있습니다 – 자세한 내용은 여기에서 확인하세요.
면책사항
해당 정보와 게시물은 금융, 투자, 트레이딩 또는 기타 유형의 조언이나 권장 사항으로 간주되지 않으며, 트레이딩뷰에서 제공하거나 보증하는 것이 아닙니다. 자세한 내용은 이용 약관을 참조하세요.