OPEN-SOURCE SCRIPT
업데이트됨 Momentum (80) + ATR (14)
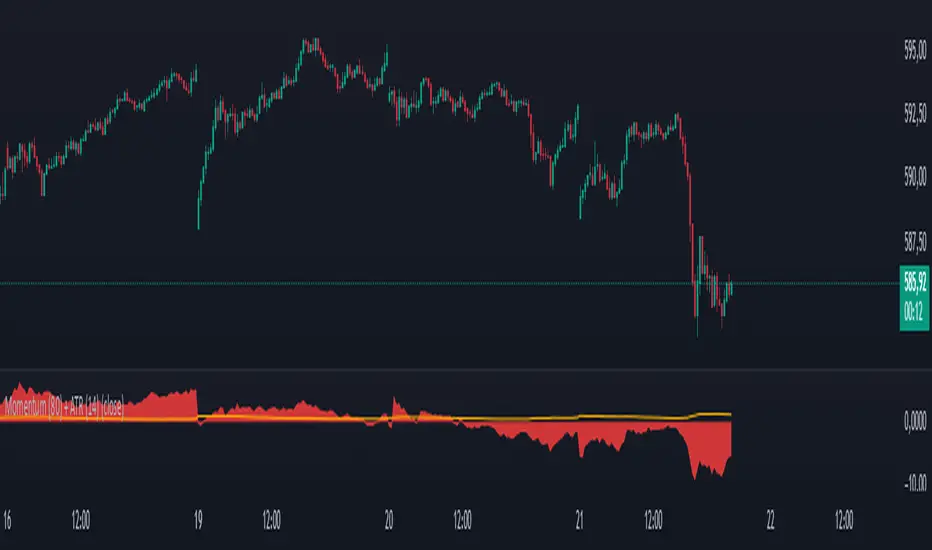
his indicator combines two essential technical analysis tools in a single panel for enhanced market insight:
🔹 Momentum (80 periods): Measures the difference between the current price and the price 80 bars ago. Displayed as a semi-transparent filled area, it helps to visually identify shifts in price momentum over a longer timeframe.
🔸 ATR (Average True Range, 14 periods): Shown as a fine orange line, the ATR represents average market volatility over 14 periods, highlighting phases of calm or increased price fluctuations.
By viewing both momentum and volatility simultaneously, traders can better assess trend strength and market conditions, improving decision-making across assets such as stocks, forex, and cryptocurrencies.
✅ Suitable for all asset types
✅ Complements other indicators like RSI, MACD, and Bollinger Bands
✅ Categorized under Momentum & Volatility indicators
릴리즈 노트
📈 Momentum (80) + ATR (14) IndicatorThis custom indicator combines two essential technical tools—Momentum and Average True Range (ATR)—to help traders better interpret both market directional strength and volatility conditions in a single view.
🔹 Momentum (80)
The momentum component calculates the difference between the current closing price and the closing price 80 periods ago:
Momentum = Close - Close[80].
This long lookback period helps to smooth out noise and highlight sustained movements in price. The result is plotted as a filled area, visually emphasizing strong upward or downward momentum. It’s especially useful for identifying emerging trends or the weakening of existing ones.
🔹 ATR (14)
The Average True Range (ATR), using a standard 14-period setting, is plotted as a single line. It provides a real-time measure of market volatility by calculating the average range between high and low prices, adjusted for gaps.
A dynamic label shows the current ATR value on the latest bar, helping traders quickly assess whether volatility is increasing or contracting—key for position sizing and risk management.
오픈 소스 스크립트
트레이딩뷰의 진정한 정신에 따라, 이 스크립트의 작성자는 이를 오픈소스로 공개하여 트레이더들이 기능을 검토하고 검증할 수 있도록 했습니다. 작성자에게 찬사를 보냅니다! 이 코드는 무료로 사용할 수 있지만, 코드를 재게시하는 경우 하우스 룰이 적용된다는 점을 기억하세요.
면책사항
해당 정보와 게시물은 금융, 투자, 트레이딩 또는 기타 유형의 조언이나 권장 사항으로 간주되지 않으며, 트레이딩뷰에서 제공하거나 보증하는 것이 아닙니다. 자세한 내용은 이용 약관을 참조하세요.
오픈 소스 스크립트
트레이딩뷰의 진정한 정신에 따라, 이 스크립트의 작성자는 이를 오픈소스로 공개하여 트레이더들이 기능을 검토하고 검증할 수 있도록 했습니다. 작성자에게 찬사를 보냅니다! 이 코드는 무료로 사용할 수 있지만, 코드를 재게시하는 경우 하우스 룰이 적용된다는 점을 기억하세요.
면책사항
해당 정보와 게시물은 금융, 투자, 트레이딩 또는 기타 유형의 조언이나 권장 사항으로 간주되지 않으며, 트레이딩뷰에서 제공하거나 보증하는 것이 아닙니다. 자세한 내용은 이용 약관을 참조하세요.