OPEN-SOURCE SCRIPT
Fisher Transform Revisited
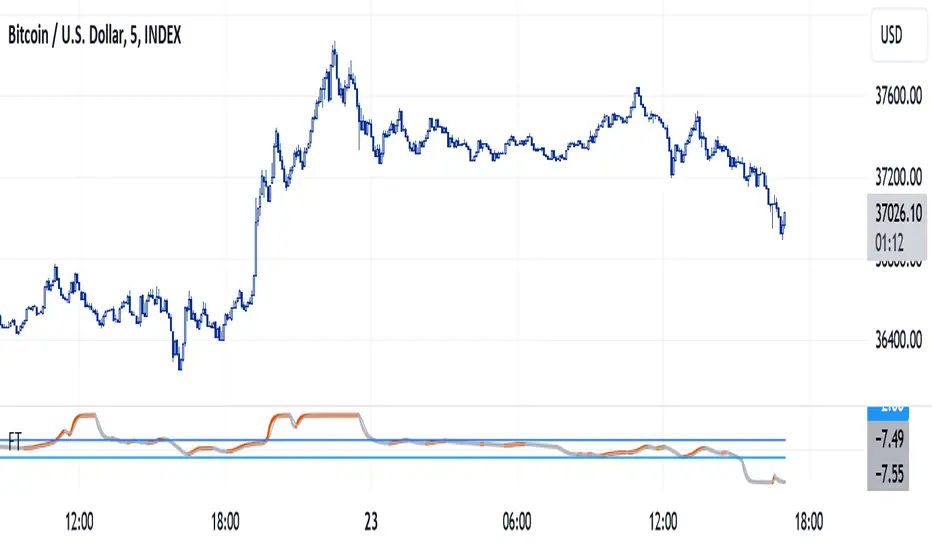
Fisher Transform developped by Ehlers is used mostly to detect peaks and troughs, which it does with little lag, but there are many false signals. Looking at its formula and construction, we can revisit it for the purpose of detecting trends and flat market.
How do we want to do that? There are 3 different actions:
As can be seen from the chart above, the revisited Fisher is above 2 for uptrend markets, below -2 for downtrending markets and in-between when the market is flat.
Notes
Usage
Of course, it should be not be used in standalone mode. Indicator is for trend traders who can stay away when market is flat. Trend start when indicator goes above 2 but like all trade indicators, it will be late; it is therefore a good idea to change n back to 1 to get a timely entry, to be confirmed of course with other elements of technical analysis.
How do we want to do that? There are 3 different actions:
- Increase the default value from usual 9 or 10 to 30
- Show the indicator as seen from upper time frame with synthetic rolling candles
- Change the weights in first formula in order to saturate the input signal, push the trend data to the limits, so therefore leaving a good view when market is flat
As can be seen from the chart above, the revisited Fisher is above 2 for uptrend markets, below -2 for downtrending markets and in-between when the market is flat.
Notes
- Weights for Fisher transform formula can be changed as parameters. Recommended valeus are 0.6 and 0.6 to saturate signal. You may come back to original formula by setting 0.33 and 0.66.
- Parameter n allows view from upper time, a multiple of current time frame. n = 1 for current chart, n = 5 for 5 minutes view on the 1 min chart
Usage
Of course, it should be not be used in standalone mode. Indicator is for trend traders who can stay away when market is flat. Trend start when indicator goes above 2 but like all trade indicators, it will be late; it is therefore a good idea to change n back to 1 to get a timely entry, to be confirmed of course with other elements of technical analysis.
오픈 소스 스크립트
트레이딩뷰의 진정한 정신에 따라, 이 스크립트의 작성자는 이를 오픈소스로 공개하여 트레이더들이 기능을 검토하고 검증할 수 있도록 했습니다. 작성자에게 찬사를 보냅니다! 이 코드는 무료로 사용할 수 있지만, 코드를 재게시하는 경우 하우스 룰이 적용된다는 점을 기억하세요.
면책사항
해당 정보와 게시물은 금융, 투자, 트레이딩 또는 기타 유형의 조언이나 권장 사항으로 간주되지 않으며, 트레이딩뷰에서 제공하거나 보증하는 것이 아닙니다. 자세한 내용은 이용 약관을 참조하세요.
오픈 소스 스크립트
트레이딩뷰의 진정한 정신에 따라, 이 스크립트의 작성자는 이를 오픈소스로 공개하여 트레이더들이 기능을 검토하고 검증할 수 있도록 했습니다. 작성자에게 찬사를 보냅니다! 이 코드는 무료로 사용할 수 있지만, 코드를 재게시하는 경우 하우스 룰이 적용된다는 점을 기억하세요.
면책사항
해당 정보와 게시물은 금융, 투자, 트레이딩 또는 기타 유형의 조언이나 권장 사항으로 간주되지 않으며, 트레이딩뷰에서 제공하거나 보증하는 것이 아닙니다. 자세한 내용은 이용 약관을 참조하세요.