OPEN-SOURCE SCRIPT
Bull-Bear Efficiency
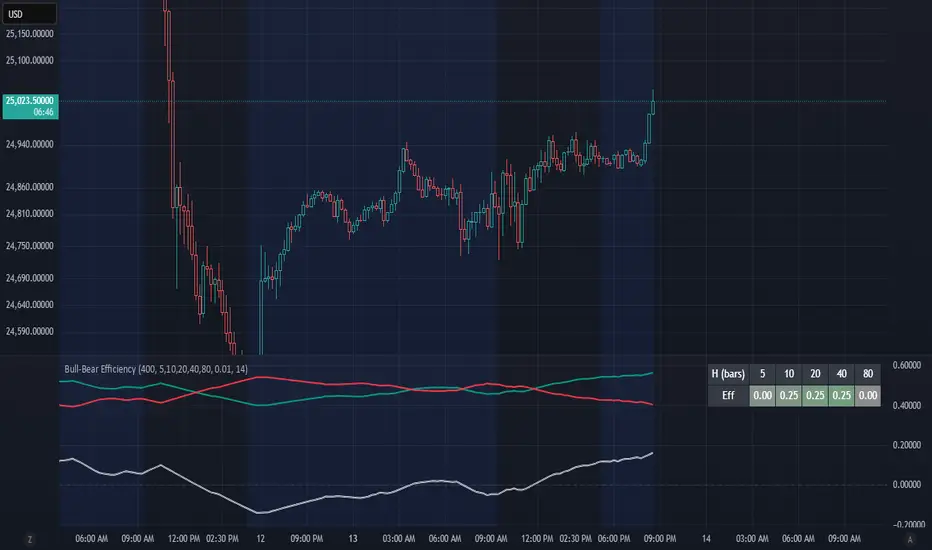
Bull-Bear Efficiency
This indicator measures the directional efficiency of price movement across many historical entry points to estimate overall market bias. It is designed as a trend gauge rather than a timing signal.
Concept
For each historical bar (tau) and a chosen lookahead horizon (h), the script evaluates how efficiently price has traveled from that starting point to the endpoint. Efficiency is defined as the net price change divided by the total absolute movement that occurred along the path.
Formula:
E(tau,h) = ( Price[tau + h] - Price[tau] ) / ( Sum from i = tau+1 to tau+h of | Price - Price[i-1] | )
This measures how "straight" the path was from the entry to the current bar:
If price moved steadily upward, the numerator and denominator are nearly equal, and E approaches +1 (efficient bullish trend).
If price moved steadily downward, E approaches -1 (efficient bearish trend).
If price chopped back and forth, the denominator grows faster than the numerator, and E approaches 0 (inefficient movement).
The algorithm computes this efficiency for many past starting points and multiple horizons, optionally normalizing by ATR to account for volatility. The efficiencies are then weighted by recency to emphasize more recent behavior.
From this, the script derives:
Bull = weighted average of positive efficiencies
Bear = weighted average of negative efficiencies (absolute value)
Net = Bull - Bear (net directional efficiency)
Interpretation
Bull, Bear, and Net quantify how coherently the market has been trending.
Bull near 1.0, Bear near 0.0, Net > 0 -> clean upward trends; long positions have been more efficient.
Bear near 1.0, Bull near 0.0, Net < 0 -> clean downward trends; short positions have been more efficient.
Bull and Bear both small or similar -> low-efficiency, range-bound environment.
Net therefore acts as a "trend coherence index" that measures whether price action is directionally organized or noisy.
Practical Use
Trend filter:
Apply trend-following systems only when Net is strongly positive or negative.
Avoid them when Net is near zero.
Regime change detection:
Crossings through zero often correspond to transitions between trending and ranging regimes.
Momentum loss detection:
If price makes new highs but Net or Bull weakens, it suggests trend exhaustion.
Settings Overview
Lookback: Number of historical bars considered as entry points (tau values).
Horizons: List of forward projection lengths (in bars) for measuring efficiency.
Recency Decay (lambda): Exponential weighting that emphasizes recent data.
Normalize by ATR: Adjusts "effort" to account for volatility changes.
Display Options: Toggle Bull, Bear, Net, or Signed Average (S). Customize line colors.
Notes
This indicator does not produce entry or exit signals.
It is a statistical tool that measures how efficiently price has trended over time.
High Net values indicate smooth, coherent trends.
Low or neutral Net values indicate noisy, directionless conditions.
오픈 소스 스크립트
트레이딩뷰의 진정한 정신에 따라, 이 스크립트의 작성자는 이를 오픈소스로 공개하여 트레이더들이 기능을 검토하고 검증할 수 있도록 했습니다. 작성자에게 찬사를 보냅니다! 이 코드는 무료로 사용할 수 있지만, 코드를 재게시하는 경우 하우스 룰이 적용된다는 점을 기억하세요.
면책사항
해당 정보와 게시물은 금융, 투자, 트레이딩 또는 기타 유형의 조언이나 권장 사항으로 간주되지 않으며, 트레이딩뷰에서 제공하거나 보증하는 것이 아닙니다. 자세한 내용은 이용 약관을 참조하세요.
오픈 소스 스크립트
트레이딩뷰의 진정한 정신에 따라, 이 스크립트의 작성자는 이를 오픈소스로 공개하여 트레이더들이 기능을 검토하고 검증할 수 있도록 했습니다. 작성자에게 찬사를 보냅니다! 이 코드는 무료로 사용할 수 있지만, 코드를 재게시하는 경우 하우스 룰이 적용된다는 점을 기억하세요.
면책사항
해당 정보와 게시물은 금융, 투자, 트레이딩 또는 기타 유형의 조언이나 권장 사항으로 간주되지 않으며, 트레이딩뷰에서 제공하거나 보증하는 것이 아닙니다. 자세한 내용은 이용 약관을 참조하세요.