INVITE-ONLY SCRIPT
업데이트됨 [Beta] Volume Footprint Statistics
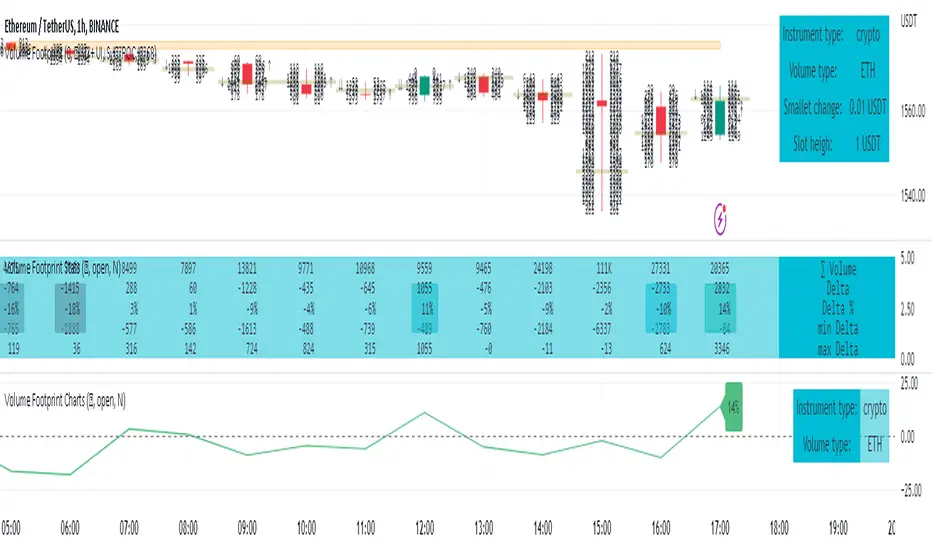
This is a script extending the functionality of "Volume Footprint" or "Volume Footprint Classic". It is showing table with candle statistics of Volume Footprint chart.
This script can be used by ANY user. You DO NOT NEED to have PRO or PREMIUM account to use it.
As a user, you have the flexibility to select the desired level of data precision for the analysis. We highly recommend using the highest precision possible, as it provides the most accurate results. However, it's important to keep in mind that Trading View has several limitations and not all levels of precision are available on all intervals. The higher the precision, the shorter the history of available data.
If, after adding the script or changing the precision, you encounter an error message stating "'The study references too many candles in history'", it may be necessary to reduce the precision level in the script settings to resolve the issue.
This script is a part of the "Volume Footprint" toolkit, which includes:
I. Footprint chart visualization scripts in two variants:
⠀⠀Volume Footprint - Presenting data on sides of the candle.
⠀⠀Volume Footprint Classic - Presenting volume data on the right side of the candle.
II. Supporting tools - They can support both Volume Footprint and Volume Footprint Classic scripts:
⠀⠀Volume Footprint Statistics - Script presents, in tabular form, basic statistics calculated from candle volume data, such as Delta, min Delta, max Delta and more.
⠀⠀Volume Footprint Charts - Tool presents in line chart form, basic statistics calculated from candle volume data, such as Delta, min Delta, max Delta and more.
⠀⠀Volume Footprint Candle Charts - Tool presents in candle chart form, basic statistics calculated from candle volume data, such as Delta, min Delta, max Delta and more.
⠀⠀Volume Footprint Candles - Tool drawing candles adapted for footprint chart scripts.
III. Tools dedicated to more detailed analysis:
⠀⠀Volume Delta In Candle - A line chart showing changes in delta values over a period equal to the chart interval.
⠀⠀Volume Cumulative Delta in Interval - A line chart showing changes in cumulative delta over a period equal to the chart interval.
Script with limited access, contact author to get authorization
User Interface:
In field after time marker script can show any configuration of the following fields:
Script settings:
Data precision - One of 6 standard levels of data precision: ▉▇▆▅▃▁, where ▉ means the highest precision and ▁ the lowest available precision and two special values "W" and "M" dedicated for biggest intervals. The highest precision should be available for 15-minute chart, but for a 1D chart, it may hit TradingView limitations and the script will not be launched by the platform with error: "'The study references too many candles in history'". The general recommendation is to use the highest available precision for a given instrument and interval.
Reset value with candle start - If selected includes in stats only values from current candle (values are starting on each candle with 0). If unchecked stats are counted from last interval and values have continuation with new candle (We have cumulative delta instead of simple delta).
Instrument and Volume status - A dialog showing basic chart information: Instrument type, Volume type, Smallest change, slot height.
Font size - Font used to show all the value: T(iny), S(mall), N(ormal), L(arge)
Color pickers for text, value background and label background.
Classic - Switch between "Volume Footprint" and "Footprint Classic" support
Missing Volume - Checking if all candle volume was counted.
∑ Volume Up - Sum of volume Up in that candle
∑ Volume Down - Sum of volume Down in that candle
∑ Volume - Candle volume
Delta (Volume Up - VolumeDown) - Difference between volume Up and Down.
min Delta - Smallest delta in that candle
max Delta - Biggest delta in that candle
Delta % - Delta as percent of candle volume (from -100% to 100%) and color selectors for highlighting value greater than 10% or smaller than -10%
Cash* - Cash value transfered in the candle. * - Value available only then "Reset value with candle start" is selected.
Troubleshooting:
In case of any problems, send error details to the author of the script.
Known issues:
"The study references too many candles in history" - Change "Data precision" settings to some lower value.
This script can be used by ANY user. You DO NOT NEED to have PRO or PREMIUM account to use it.
As a user, you have the flexibility to select the desired level of data precision for the analysis. We highly recommend using the highest precision possible, as it provides the most accurate results. However, it's important to keep in mind that Trading View has several limitations and not all levels of precision are available on all intervals. The higher the precision, the shorter the history of available data.
If, after adding the script or changing the precision, you encounter an error message stating "'The study references too many candles in history'", it may be necessary to reduce the precision level in the script settings to resolve the issue.
This script is a part of the "Volume Footprint" toolkit, which includes:
I. Footprint chart visualization scripts in two variants:
⠀⠀Volume Footprint - Presenting data on sides of the candle.
⠀⠀Volume Footprint Classic - Presenting volume data on the right side of the candle.
II. Supporting tools - They can support both Volume Footprint and Volume Footprint Classic scripts:
⠀⠀Volume Footprint Statistics - Script presents, in tabular form, basic statistics calculated from candle volume data, such as Delta, min Delta, max Delta and more.
⠀⠀Volume Footprint Charts - Tool presents in line chart form, basic statistics calculated from candle volume data, such as Delta, min Delta, max Delta and more.
⠀⠀Volume Footprint Candle Charts - Tool presents in candle chart form, basic statistics calculated from candle volume data, such as Delta, min Delta, max Delta and more.
⠀⠀Volume Footprint Candles - Tool drawing candles adapted for footprint chart scripts.
III. Tools dedicated to more detailed analysis:
⠀⠀Volume Delta In Candle - A line chart showing changes in delta values over a period equal to the chart interval.
⠀⠀Volume Cumulative Delta in Interval - A line chart showing changes in cumulative delta over a period equal to the chart interval.
Script with limited access, contact author to get authorization
User Interface:
In field after time marker script can show any configuration of the following fields:
- Missing Volume
- ∑ Volume Up
- ∑ Volume Down
- ∑ Volume
- Delta (Volume Up - VolumeDown)
- min Delta
- max Delta
- Delta %
- Cash
Script settings:
Data precision - One of 6 standard levels of data precision: ▉▇▆▅▃▁, where ▉ means the highest precision and ▁ the lowest available precision and two special values "W" and "M" dedicated for biggest intervals. The highest precision should be available for 15-minute chart, but for a 1D chart, it may hit TradingView limitations and the script will not be launched by the platform with error: "'The study references too many candles in history'". The general recommendation is to use the highest available precision for a given instrument and interval.
Reset value with candle start - If selected includes in stats only values from current candle (values are starting on each candle with 0). If unchecked stats are counted from last interval and values have continuation with new candle (We have cumulative delta instead of simple delta).
Instrument and Volume status - A dialog showing basic chart information: Instrument type, Volume type, Smallest change, slot height.
Font size - Font used to show all the value: T(iny), S(mall), N(ormal), L(arge)
Color pickers for text, value background and label background.
Classic - Switch between "Volume Footprint" and "Footprint Classic" support
Missing Volume - Checking if all candle volume was counted.
∑ Volume Up - Sum of volume Up in that candle
∑ Volume Down - Sum of volume Down in that candle
∑ Volume - Candle volume
Delta (Volume Up - VolumeDown) - Difference between volume Up and Down.
min Delta - Smallest delta in that candle
max Delta - Biggest delta in that candle
Delta % - Delta as percent of candle volume (from -100% to 100%) and color selectors for highlighting value greater than 10% or smaller than -10%
Cash* - Cash value transfered in the candle. * - Value available only then "Reset value with candle start" is selected.
Troubleshooting:
In case of any problems, send error details to the author of the script.
Known issues:
"The study references too many candles in history" - Change "Data precision" settings to some lower value.
릴리즈 노트
Package of improvements 릴리즈 노트
Package of improvements 릴리즈 노트
Added color settings릴리즈 노트
Package of improvements:- Added Cash statistics
- Addition precision levels dedicated to 1W and 1M charts.
- Verification with main script feature
- Improved error reporting
릴리즈 노트
Added "Instrument and Volume status" dialog릴리즈 노트
Set of improvements: - Posibility of drawing below bar or on the right of it - To support both Volume Footprint and Volume Footprint Classic scripts.
- Experimental background color change feature based on current field value.
릴리즈 노트
Added "Reset value with candle start" 릴리즈 노트
Alerts - Option to send alerts if delta is over/under 1%/20%릴리즈 노트
Added short labels초대 전용 스크립트
이 스크립트는 작성자가 승인한 사용자만 접근할 수 있습니다. 사용하려면 요청 후 승인을 받아야 하며, 일반적으로 결제 후에 허가가 부여됩니다. 자세한 내용은 아래 작성자의 안내를 따르거나 Investor_R에게 직접 문의하세요.
이 비공개 초대 전용 스크립트는 스크립트 모더레이터의 검토를 거치지 않았으며, 하우스 룰 준수 여부는 확인되지 않았습니다. 트레이딩뷰는 스크립트의 작동 방식을 충분히 이해하고 작성자를 완전히 신뢰하지 않는 이상, 해당 스크립트에 비용을 지불하거나 사용하는 것을 권장하지 않습니다. 커뮤니티 스크립트에서 무료 오픈소스 대안을 찾아보실 수도 있습니다.
작성자 지시 사항
To get access or report problem write on toolkit4trading@proton.me
To get access or report problem write on toolkit4trading@proton.me
More details on Website and Youtube.
More details on Website and Youtube.
면책사항
해당 정보와 게시물은 금융, 투자, 트레이딩 또는 기타 유형의 조언이나 권장 사항으로 간주되지 않으며, 트레이딩뷰에서 제공하거나 보증하는 것이 아닙니다. 자세한 내용은 이용 약관을 참조하세요.
초대 전용 스크립트
이 스크립트는 작성자가 승인한 사용자만 접근할 수 있습니다. 사용하려면 요청 후 승인을 받아야 하며, 일반적으로 결제 후에 허가가 부여됩니다. 자세한 내용은 아래 작성자의 안내를 따르거나 Investor_R에게 직접 문의하세요.
이 비공개 초대 전용 스크립트는 스크립트 모더레이터의 검토를 거치지 않았으며, 하우스 룰 준수 여부는 확인되지 않았습니다. 트레이딩뷰는 스크립트의 작동 방식을 충분히 이해하고 작성자를 완전히 신뢰하지 않는 이상, 해당 스크립트에 비용을 지불하거나 사용하는 것을 권장하지 않습니다. 커뮤니티 스크립트에서 무료 오픈소스 대안을 찾아보실 수도 있습니다.
작성자 지시 사항
To get access or report problem write on toolkit4trading@proton.me
To get access or report problem write on toolkit4trading@proton.me
More details on Website and Youtube.
More details on Website and Youtube.
면책사항
해당 정보와 게시물은 금융, 투자, 트레이딩 또는 기타 유형의 조언이나 권장 사항으로 간주되지 않으며, 트레이딩뷰에서 제공하거나 보증하는 것이 아닙니다. 자세한 내용은 이용 약관을 참조하세요.