OPEN-SOURCE SCRIPT
Ticker Ratio Levels
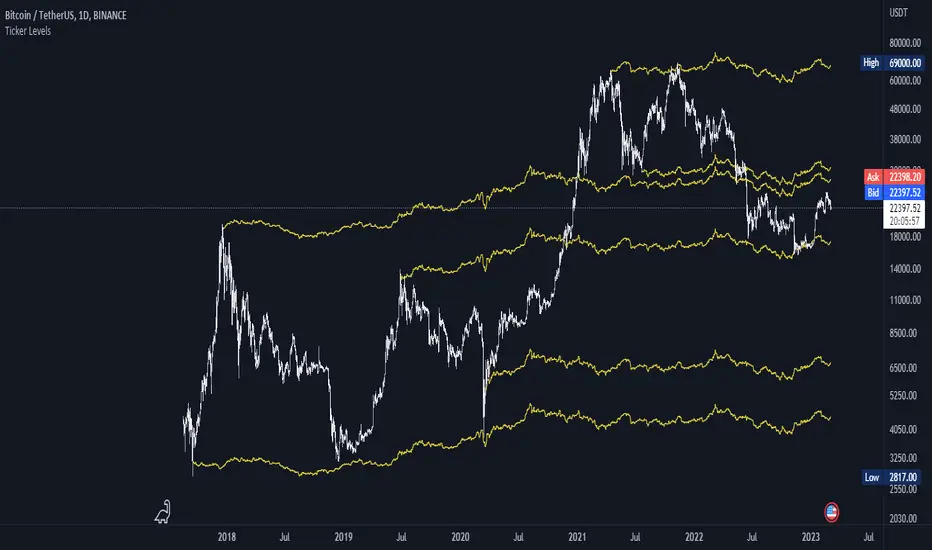
Indicator for constructing levels of price ratios from other tickers.
The user can choose from predefined tickers such as Gold(XAU), DXY, BTC, etc.
Takes the important extremum of the closing candle from your current chart and builds a level based on the chart selected in the settings.
This function allows you to determine the price level based on the current price and the price at the time of a certain date. To do this, it first determines the time when the last candle before the specified date occurred. Then the price at the time of this candle and at the current moment is calculated. Finally, the price level is calculated relative to the price at the time of the candle. The result of this calculation will be the price level.
By default, the indicator is set to 1D for the BTC chart. But you can adjust any levels on the assets you are interested in.
You can adjust the levels both in the settings and by moving them around the chart.
Simply click on the indicator name or level, and vertical lines will appear, which you can drag to any location. (The vertical lines serve as the beginning of the calculation point)
Example of work on ETH paired with DXY.

The user can choose from predefined tickers such as Gold(XAU), DXY, BTC, etc.
- How it works:
Takes the important extremum of the closing candle from your current chart and builds a level based on the chart selected in the settings.
This function allows you to determine the price level based on the current price and the price at the time of a certain date. To do this, it first determines the time when the last candle before the specified date occurred. Then the price at the time of this candle and at the current moment is calculated. Finally, the price level is calculated relative to the price at the time of the candle. The result of this calculation will be the price level.
- How to Use:
By default, the indicator is set to 1D for the BTC chart. But you can adjust any levels on the assets you are interested in.
You can adjust the levels both in the settings and by moving them around the chart.
Simply click on the indicator name or level, and vertical lines will appear, which you can drag to any location. (The vertical lines serve as the beginning of the calculation point)
Example of work on ETH paired with DXY.
오픈 소스 스크립트
트레이딩뷰의 진정한 정신에 따라, 이 스크립트의 작성자는 이를 오픈소스로 공개하여 트레이더들이 기능을 검토하고 검증할 수 있도록 했습니다. 작성자에게 찬사를 보냅니다! 이 코드는 무료로 사용할 수 있지만, 코드를 재게시하는 경우 하우스 룰이 적용된다는 점을 기억하세요.
면책사항
해당 정보와 게시물은 금융, 투자, 트레이딩 또는 기타 유형의 조언이나 권장 사항으로 간주되지 않으며, 트레이딩뷰에서 제공하거나 보증하는 것이 아닙니다. 자세한 내용은 이용 약관을 참조하세요.
오픈 소스 스크립트
트레이딩뷰의 진정한 정신에 따라, 이 스크립트의 작성자는 이를 오픈소스로 공개하여 트레이더들이 기능을 검토하고 검증할 수 있도록 했습니다. 작성자에게 찬사를 보냅니다! 이 코드는 무료로 사용할 수 있지만, 코드를 재게시하는 경우 하우스 룰이 적용된다는 점을 기억하세요.
면책사항
해당 정보와 게시물은 금융, 투자, 트레이딩 또는 기타 유형의 조언이나 권장 사항으로 간주되지 않으며, 트레이딩뷰에서 제공하거나 보증하는 것이 아닙니다. 자세한 내용은 이용 약관을 참조하세요.