OPEN-SOURCE SCRIPT
업데이트됨 Daily Historical Volatility StdDev Levels

Description:
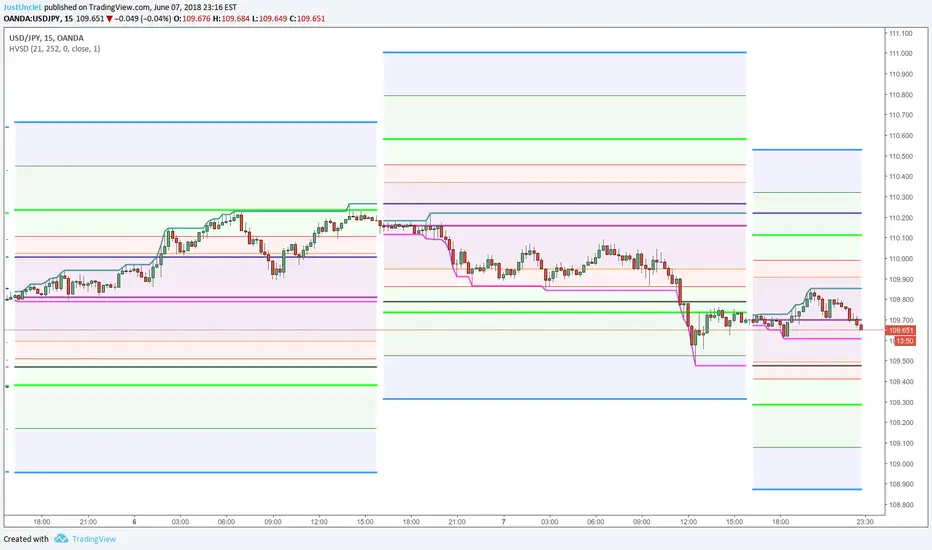
This indicator plots Daily Standard deviation levels on price chart based on Historical Volatility (HV). It uses the most common approach for calculating historical volatility as standard deviation of logarithmic returns, based on daily closing/settlement prices.
Assets: Currency Pairs, Commodities, also works on stocks, some indices.
Time Frames: 5min to 60min. This will also work on Daily Chart, by setting "DaystoExpire" to 21
Options:
References:
This indicator plots Daily Standard deviation levels on price chart based on Historical Volatility (HV). It uses the most common approach for calculating historical volatility as standard deviation of logarithmic returns, based on daily closing/settlement prices.
Assets: Currency Pairs, Commodities, also works on stocks, some indices.
Time Frames: 5min to 60min. This will also work on Daily Chart, by setting "DaystoExpire" to 21
Options:
- Use Daily Data to Calculate StdDev HV (default), otherwise use the charts Time Frame
- Lookback = number of days/periods to calculate stddev of HV (21 by default)
- Annual = number of trading days in a calender year (252 by default)
- Days to Expiry = number of days for the life of this option ( for auto calculation
this is 1 for intraday, 21 for daily and annual when chart TF used) - Settlement Source = close price by default, can use another source.
- Settlement Volume Weighted Average Length = by setting this to >1 then an average
is used for settlement. - Display ### Standard Deviation Levels = select what levels are to be displayed.
References:
- How To Use Standard Deviation In Your Trading Day: https://www.youtube.com/watch?v=i28w9HBmJdQ&feature=youtu.be
- Deviation Levels Indicator: [url= youtube.com/watch?v=EjHDNIKQH5k&feature=youtu.be]youtube.com/watch?v=EjHDNIKQH5k&feature=youtu.be
- http://www.macroption.com/historical-volatility-calculation/
- Historical Volatility based Standard Deviation_V2 by ucsgears
- Historical Volatility Strategy by Hpotter
릴리즈 노트
Corrected Change of day detection for Intraday TFsCorrected -0.75 Label.
릴리즈 노트
Small changes:- Changed to only display background fill for upto +/- 1 Stddev.
- Added option to Display Todays Only Levels.
릴리즈 노트
...- Made changes so that it also work with Renko Charts, BUT only works well with short TF (<=5min) and brick (<=6pip).
- Added Option to display Previous Day's High Low Levels.
- Added Option to display Current Day's High Low Levels.
- Changed 0.75 level to 0.7 level.
- Shortened short title to "HVSD" for easier visual when Indicator Labels are used.
릴리즈 노트
Efficiency Update- Improved efficiency by reducing the number of plot lines required by adding "style=2" (Line with Breaks) to the plot options.
- Added fill colour for 2nd and 3rd Stddevs.
릴리즈 노트
Minor update- Corrected no History flag "nohist" calculation, would misread the number of days of data left in the history.
오픈 소스 스크립트
트레이딩뷰의 진정한 정신에 따라, 이 스크립트의 작성자는 이를 오픈소스로 공개하여 트레이더들이 기능을 검토하고 검증할 수 있도록 했습니다. 작성자에게 찬사를 보냅니다! 이 코드는 무료로 사용할 수 있지만, 코드를 재게시하는 경우 하우스 룰이 적용된다는 점을 기억하세요.
JustUncleL
면책사항
해당 정보와 게시물은 금융, 투자, 트레이딩 또는 기타 유형의 조언이나 권장 사항으로 간주되지 않으며, 트레이딩뷰에서 제공하거나 보증하는 것이 아닙니다. 자세한 내용은 이용 약관을 참조하세요.
오픈 소스 스크립트
트레이딩뷰의 진정한 정신에 따라, 이 스크립트의 작성자는 이를 오픈소스로 공개하여 트레이더들이 기능을 검토하고 검증할 수 있도록 했습니다. 작성자에게 찬사를 보냅니다! 이 코드는 무료로 사용할 수 있지만, 코드를 재게시하는 경우 하우스 룰이 적용된다는 점을 기억하세요.
JustUncleL
면책사항
해당 정보와 게시물은 금융, 투자, 트레이딩 또는 기타 유형의 조언이나 권장 사항으로 간주되지 않으며, 트레이딩뷰에서 제공하거나 보증하는 것이 아닙니다. 자세한 내용은 이용 약관을 참조하세요.