INVITE-ONLY SCRIPT
Anchored Square of 9 by AlgoCados
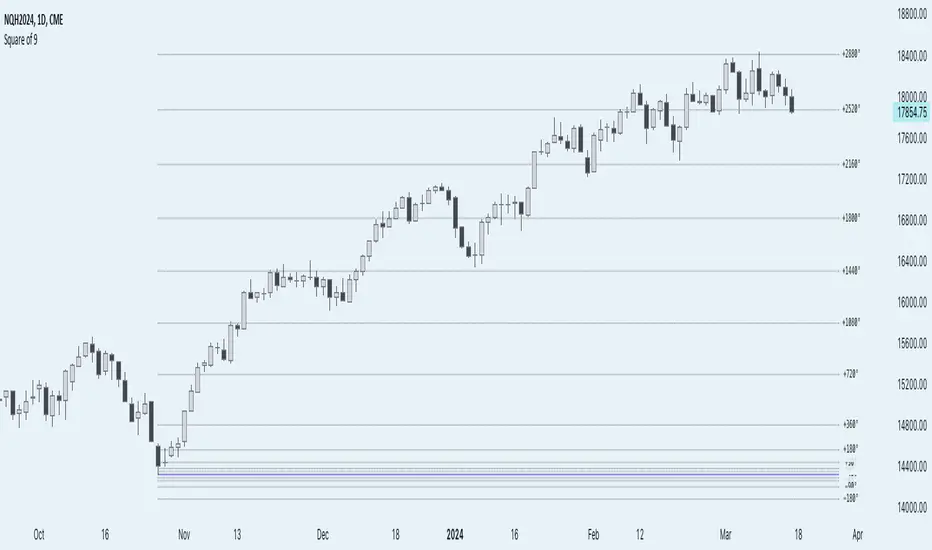
The 'Anchored Square of 9 by AlgoCados' pine script indicator, leverages the non-discretionary, mathematical principles of W.D. Gann's Square of 9 for predicting vital support and resistance levels across all financial assets. Its mathematical precision and versatility make it a universally applicable tool, suitable for analysis of any financial asset without bias. Characterized by its adaptability to both high and low time frame analyses (HTF and LTF), this sophisticated indicator provides a structured, reliable method for market analysis, making it an essential asset for traders looking to apply a consistent and comprehensive approach across various market conditions and asset classes.
 NQH2024

Core Functionality
Anchored Price Point: The script allows users to define an anchor time and anchor point type (High, Low, Open, Close), serving as the basis for subsequent calculations. This flexibility enables precise adaptation to varying market conditions and analysis needs.
Angular Shifts and Projection: The indicator implements a range of angular shifts for LTF and HTF analyses, allowing for detailed and customizable projection of support and resistance levels. Angular shifts can range from 11.25° for finer intraday nuances up to 7200° for broader, long-term trend insights.
Mathematical Implementation
Anchor Point Selection: The script selects an anchor point based on user inputs for the anchor type and anchor time. This point serves as the basis for calculating deviations.
Angular Shift Calculation: The indicator calculates deviations by applying angular shifts to the square root of the anchor price. These deviations are used to project potential support and resistance levels.
Projection Lines and Labels: For each angular shift, the script generates projection lines and labels, which are dynamically adjusted as new data becomes available. This visual representation aids in identifying significant price levels.
NQH2024

Key Features and Customization Options
Customizable Angular Shifts: Traders can enable or disable specific angular shifts to tailor the analysis to their trading strategy.
Projection Styles and Labels: Offers various styles (Solid, Dotted, Dashed) for equilibrium, upper shifts, and lower shifts lines, along with customizable label options (Levels, Prices, Levels + Prices) for enhanced clarity and information density.
Dynamic Labeling: Utilizes dynamic labeling for each projection line, indicating the angular degree and price level, facilitating a comprehensive understanding of potential market movements.
User-Friendly Inputs: Features user-defined inputs for anchor time and type, angular shifts, line styles, and labeling options, making the tool highly adaptable and intuitive.
Pine Script Technical Insight
Input Handling: The script incorporates a series of input controls to allow users to specify the anchor time, anchor type, and which angular shifts to display.
Line and Label Generation: Utilizes Pine Script's capabilities to dynamically generate and adjust projection lines and labels based on the calculated support and resistance levels.
Efficiency and Adaptability: Efficiently loops through a predefined set of angles, applying them to the anchored price point to calculate and project support and resistance levels, demonstrating the script's adaptability to both intraday and longer-term analysis.
Mathematical Formulation and Indicator Logic
Initial Setup and Inputs
The indicator starts by capturing user inputs for the anchor point—this can be a High, Low, Open, or Close price at a specified anchor time. These inputs determine the base price (P-base) from which all calculations are derived.
High if Anchor Type = "High"
Low if Anchor Type = "Low"
Open if Anchor Type = "Open"
Close if Anchor Type = "Close"
Angular Shifts and Projection Basis
The core of the "Anchored Square of 9" methodology involves calculating support and resistance levels through angular shifts applied to the Price-base (P-base).
The indicator enables a series of angular shifts, specified by the user, to project these levels dynamically.
Angular shifts are interpreted through the lens of Gann's theory, with each degree corresponding to a potential market turn or equilibrium point.
The script translates these angles into actionable projections using the square root of the anchor price, then applies the angular coefficients to find deviation points.
Angular Coefficients and Pi
In the context of the "Anchored Square of 9" indicator, angular shifts are crucial for projecting potential support and resistance levels. These shifts are quantified by angular coefficients derived from geometric principles, specifically leveraging the relationship between angles in degrees and their radian counterparts using π (Pi). Here's how angular coefficients are integrated:
Pi Reference for Angular Shifts: Given that 360° equates to 2π radians, angular coefficients (θ) for the indicator are calculated by translating degrees into a radian measure and then applying this measure to modify the square root of the base price (P-base).
Example of Angular Coefficients Shift:
A 180° shift corresponds to π radians. In the indicator's formula, this would translate to an angular coefficient of 1, since 180° = π in terms of π. Thus, applying this angular shift involves adding or subtracting 1 from the square root of P-base and then squaring the result to project a new price level.
Similarly, a 90° shift, equating to π/2, would have an angular coefficient equivalent to 0.5, reflecting its proportion of the circle (or square, in the context of Gann's geometry).
Implementation in Calculation of Deviations
Incorporating π into the formula for calculating deviations enriches the indicator's mathematical foundation, providing a direct link to geometric principles:
For each selected angular shift (θ), the script calculates positive and negative deviations from the square root of the anchor price. These deviations represent potential support and resistance levels.
P± = round (( sqrt root (P-base) ± θ)²)
Where:
P ± represents the calculated price levels for support (-) and resistance levels (+);
θ is the angular coefficient derived from the user-selected angular shifts;
sqrt root (P-base) is the square root of the base price;
round (⋅) ensures that the calculated levels are adjusted to the nearest tick size, maintaining relevance to actual trading scenarios.
Dynamic Projections and Visualization
The script generates lines and labels for these calculated levels, dynamically extending them as new market data becomes available. This feature ensures that traders have the most current and relevant information for decision-making.
For visualization:
Equilibrium Lines: Drawn at P-base to indicate the anchor or equilibrium point.
Support and Resistance Lines: Drawn at P- and P+, respectively, showing potential levels of market reaction
NQH2024

Labeling and Style Customization
The indicator provides extensive customization for the appearance of projection lines and labels. Traders can select the line style, color, and text information (levels, prices, or both) to be displayed, tailoring the visual output to their preferences and trading strategy.
Implementation Details
This detailed approach to calculating support and resistance levels showcases the indicator's adherence to Gann's principles while leveraging modern computational methods to enhance trading analysis. By translating angular shifts into quantifiable projections, the "AlgoCados x Anchored Square of 9" indicator offers a powerful tool for identifying potential market movements with high precision.
The Pine Script implementation encapsulates this complex logic within a user-friendly interface, allowing traders to harness advanced analytical techniques within the TradingView platform. Through dynamic calculation and visualization, the indicator equips users with a deep understanding of market structures, enabling informed trading decisions based on mathematical projections.
Conclusion
The 'Anchored Square of 9 by AlgoCados' indicator merges mathematical precision with trading intuition, offering an advanced tool for traders seeking to leverage the time-tested principles of W.D. Gann's Square of 9. With its comprehensive set of features and customization options, it stands as a powerful addition to the TradingView platform, designed to enhance market analysis and decision-making for traders at all levels.
Embrace the essence of smarter trading where every insight is "Healthy For Your Trading."
Core Functionality
Anchored Price Point: The script allows users to define an anchor time and anchor point type (High, Low, Open, Close), serving as the basis for subsequent calculations. This flexibility enables precise adaptation to varying market conditions and analysis needs.
Angular Shifts and Projection: The indicator implements a range of angular shifts for LTF and HTF analyses, allowing for detailed and customizable projection of support and resistance levels. Angular shifts can range from 11.25° for finer intraday nuances up to 7200° for broader, long-term trend insights.
Mathematical Implementation
Anchor Point Selection: The script selects an anchor point based on user inputs for the anchor type and anchor time. This point serves as the basis for calculating deviations.
Angular Shift Calculation: The indicator calculates deviations by applying angular shifts to the square root of the anchor price. These deviations are used to project potential support and resistance levels.
Projection Lines and Labels: For each angular shift, the script generates projection lines and labels, which are dynamically adjusted as new data becomes available. This visual representation aids in identifying significant price levels.
Key Features and Customization Options
Customizable Angular Shifts: Traders can enable or disable specific angular shifts to tailor the analysis to their trading strategy.
Projection Styles and Labels: Offers various styles (Solid, Dotted, Dashed) for equilibrium, upper shifts, and lower shifts lines, along with customizable label options (Levels, Prices, Levels + Prices) for enhanced clarity and information density.
Dynamic Labeling: Utilizes dynamic labeling for each projection line, indicating the angular degree and price level, facilitating a comprehensive understanding of potential market movements.
User-Friendly Inputs: Features user-defined inputs for anchor time and type, angular shifts, line styles, and labeling options, making the tool highly adaptable and intuitive.
Pine Script Technical Insight
Input Handling: The script incorporates a series of input controls to allow users to specify the anchor time, anchor type, and which angular shifts to display.
Line and Label Generation: Utilizes Pine Script's capabilities to dynamically generate and adjust projection lines and labels based on the calculated support and resistance levels.
Efficiency and Adaptability: Efficiently loops through a predefined set of angles, applying them to the anchored price point to calculate and project support and resistance levels, demonstrating the script's adaptability to both intraday and longer-term analysis.
Mathematical Formulation and Indicator Logic
Initial Setup and Inputs
The indicator starts by capturing user inputs for the anchor point—this can be a High, Low, Open, or Close price at a specified anchor time. These inputs determine the base price (P-base) from which all calculations are derived.
High if Anchor Type = "High"
Low if Anchor Type = "Low"
Open if Anchor Type = "Open"
Close if Anchor Type = "Close"
Angular Shifts and Projection Basis
The core of the "Anchored Square of 9" methodology involves calculating support and resistance levels through angular shifts applied to the Price-base (P-base).
The indicator enables a series of angular shifts, specified by the user, to project these levels dynamically.
Angular shifts are interpreted through the lens of Gann's theory, with each degree corresponding to a potential market turn or equilibrium point.
The script translates these angles into actionable projections using the square root of the anchor price, then applies the angular coefficients to find deviation points.
Angular Coefficients and Pi
In the context of the "Anchored Square of 9" indicator, angular shifts are crucial for projecting potential support and resistance levels. These shifts are quantified by angular coefficients derived from geometric principles, specifically leveraging the relationship between angles in degrees and their radian counterparts using π (Pi). Here's how angular coefficients are integrated:
Pi Reference for Angular Shifts: Given that 360° equates to 2π radians, angular coefficients (θ) for the indicator are calculated by translating degrees into a radian measure and then applying this measure to modify the square root of the base price (P-base).
Example of Angular Coefficients Shift:
A 180° shift corresponds to π radians. In the indicator's formula, this would translate to an angular coefficient of 1, since 180° = π in terms of π. Thus, applying this angular shift involves adding or subtracting 1 from the square root of P-base and then squaring the result to project a new price level.
Similarly, a 90° shift, equating to π/2, would have an angular coefficient equivalent to 0.5, reflecting its proportion of the circle (or square, in the context of Gann's geometry).
Implementation in Calculation of Deviations
Incorporating π into the formula for calculating deviations enriches the indicator's mathematical foundation, providing a direct link to geometric principles:
For each selected angular shift (θ), the script calculates positive and negative deviations from the square root of the anchor price. These deviations represent potential support and resistance levels.
P± = round (( sqrt root (P-base) ± θ)²)
Where:
P ± represents the calculated price levels for support (-) and resistance levels (+);
θ is the angular coefficient derived from the user-selected angular shifts;
sqrt root (P-base) is the square root of the base price;
round (⋅) ensures that the calculated levels are adjusted to the nearest tick size, maintaining relevance to actual trading scenarios.
Dynamic Projections and Visualization
The script generates lines and labels for these calculated levels, dynamically extending them as new market data becomes available. This feature ensures that traders have the most current and relevant information for decision-making.
For visualization:
Equilibrium Lines: Drawn at P-base to indicate the anchor or equilibrium point.
Support and Resistance Lines: Drawn at P- and P+, respectively, showing potential levels of market reaction
Labeling and Style Customization
The indicator provides extensive customization for the appearance of projection lines and labels. Traders can select the line style, color, and text information (levels, prices, or both) to be displayed, tailoring the visual output to their preferences and trading strategy.
Implementation Details
This detailed approach to calculating support and resistance levels showcases the indicator's adherence to Gann's principles while leveraging modern computational methods to enhance trading analysis. By translating angular shifts into quantifiable projections, the "AlgoCados x Anchored Square of 9" indicator offers a powerful tool for identifying potential market movements with high precision.
The Pine Script implementation encapsulates this complex logic within a user-friendly interface, allowing traders to harness advanced analytical techniques within the TradingView platform. Through dynamic calculation and visualization, the indicator equips users with a deep understanding of market structures, enabling informed trading decisions based on mathematical projections.
Conclusion
The 'Anchored Square of 9 by AlgoCados' indicator merges mathematical precision with trading intuition, offering an advanced tool for traders seeking to leverage the time-tested principles of W.D. Gann's Square of 9. With its comprehensive set of features and customization options, it stands as a powerful addition to the TradingView platform, designed to enhance market analysis and decision-making for traders at all levels.
Embrace the essence of smarter trading where every insight is "Healthy For Your Trading."
초대 전용 스크립트
이 스크립트는 작성자가 승인한 사용자만 접근할 수 있습니다. 사용하려면 요청을 보내고 승인을 받아야 합니다. 일반적으로 결제 후에 승인이 이루어집니다. 자세한 내용은 아래 작성자의 지침을 따르거나 AlgoCados에게 직접 문의하세요.
트레이딩뷰는 스크립트 작성자를 완전히 신뢰하고 스크립트 작동 방식을 이해하지 않는 한 스크립트 비용을 지불하거나 사용하지 않는 것을 권장하지 않습니다. 무료 오픈소스 대체 스크립트는 커뮤니티 스크립트에서 찾을 수 있습니다.
작성자 지시 사항
To ensure you're using the latest version, please remove it from your chart and re-add it. Get Access Here: https://algocados.com/product/algocados-anchored-square-of-9/
AlgoCados
면책사항
이 정보와 게시물은 TradingView에서 제공하거나 보증하는 금융, 투자, 거래 또는 기타 유형의 조언이나 권고 사항을 의미하거나 구성하지 않습니다. 자세한 내용은 이용 약관을 참고하세요.