OPEN-SOURCE SCRIPT
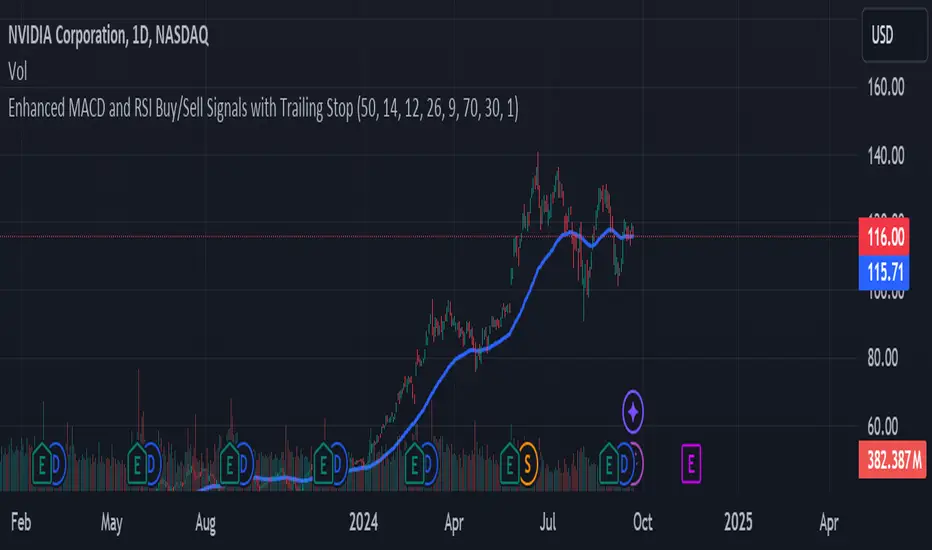
업데이트됨 Enhanced MACD and RSI Buy/Sell Signals - Created by Marco Nucup
Key Features:
EMA Filter: Adds an Exponential Moving Average (EMA) to filter signals based on the trend. Buys are only considered when the price is above the EMA, and sells when below it.
Customizable Inputs: Users can adjust parameters for EMA, MACD, and RSI directly from the TradingView interface, allowing for more personalized strategies.
Alerts: The script includes alert conditions for both buy and sell signals, enabling users to receive notifications.
Signal Plotting: Visual indicators for buy and sell signals on the chart, along with the EMA line for trend reference.
릴리즈 노트
Interpret the Signals:Buy Signal: A green "BUY" label will appear below the bars when the following conditions are met:
The MACD line crosses above the signal line.
The RSI is below the oversold level (default is 30).
The price is above the EMA (default is 50-period).
Sell Signal: A red "SELL" label will appear above the bars when:
The MACD line crosses below the signal line.
The RSI is above the overbought level (default is 70).
The price is below the EMA.
Trailing Stop Loss: A red line indicating the trailing stop loss will be plotted on the chart, adjusting as the price moves. This helps protect your profits.
Set Up Alerts:
To receive alerts for buy and sell signals, click on the "Alerts" icon (alarm bell) in the right toolbar. Choose the conditions based on the script's alerts for buy and sell signals.
Understanding the Components
EMA (Exponential Moving Average): A trend-following indicator that smooths price data to identify the direction of the trend. The script uses a 50-period EMA.
MACD (Moving Average Convergence Divergence): A momentum indicator that shows the relationship between two moving averages. It generates buy and sell signals based on crossovers.
RSI (Relative Strength Index): A momentum oscillator that measures the speed and change of price movements. It helps identify overbought or oversold conditions.
Trailing Stop Loss: A dynamic stop-loss level that adjusts as the price moves in your favor, designed to lock in profits while allowing for potential gains.
Best Practices
Backtest: Use historical data to backtest the strategy before applying it to live trading.
Risk Management: Always consider risk management strategies, including position sizing and setting a maximum loss limit.
Market Conditions: Be aware of the market environment (trending vs. ranging markets) as this strategy may perform differently under varying conditions.
오픈 소스 스크립트
트레이딩뷰의 진정한 정신에 따라, 이 스크립트의 작성자는 이를 오픈소스로 공개하여 트레이더들이 기능을 검토하고 검증할 수 있도록 했습니다. 작성자에게 찬사를 보냅니다! 이 코드는 무료로 사용할 수 있지만, 코드를 재게시하는 경우 하우스 룰이 적용된다는 점을 기억하세요.
면책사항
해당 정보와 게시물은 금융, 투자, 트레이딩 또는 기타 유형의 조언이나 권장 사항으로 간주되지 않으며, 트레이딩뷰에서 제공하거나 보증하는 것이 아닙니다. 자세한 내용은 이용 약관을 참조하세요.
오픈 소스 스크립트
트레이딩뷰의 진정한 정신에 따라, 이 스크립트의 작성자는 이를 오픈소스로 공개하여 트레이더들이 기능을 검토하고 검증할 수 있도록 했습니다. 작성자에게 찬사를 보냅니다! 이 코드는 무료로 사용할 수 있지만, 코드를 재게시하는 경우 하우스 룰이 적용된다는 점을 기억하세요.
면책사항
해당 정보와 게시물은 금융, 투자, 트레이딩 또는 기타 유형의 조언이나 권장 사항으로 간주되지 않으며, 트레이딩뷰에서 제공하거나 보증하는 것이 아닙니다. 자세한 내용은 이용 약관을 참조하세요.