PROTECTED SOURCE SCRIPT
RainDrop Panel
Hi everyone,
This script shows the Dashboard in a Table. Table.new() is a new feature and released today! Big thanks to Pine Team for adding this great new feature!
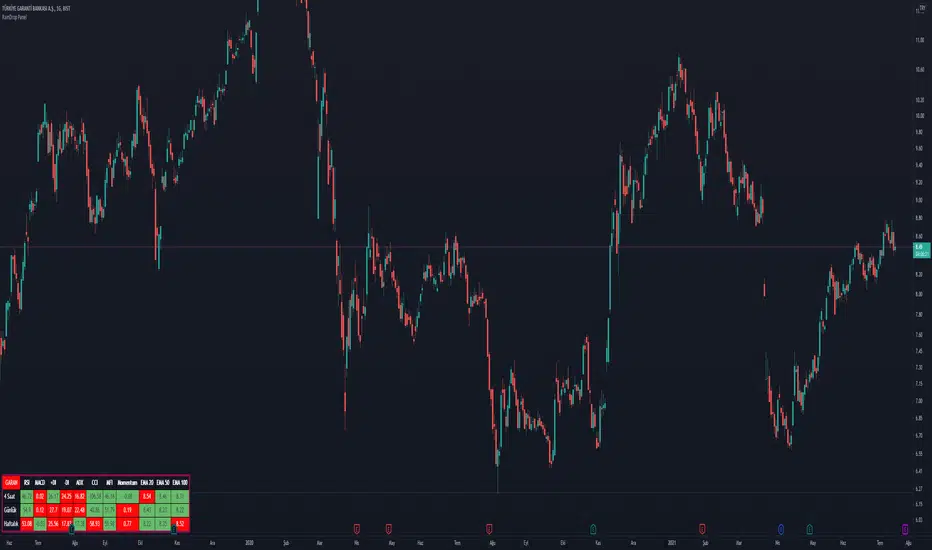
This new feature changes the rules of the game! The script shows 3 different time period indicator values for the icon and changes the background color of each cell using the current and last values of the indicators for the icon. The background color is green if the current value is greater than the last value, red if it is less than the last value, and gray if it is equal. You can select the time periods and Indicators to be displayed. You can also change the position, font sizes, title and text colors of the relevant panel on the graphic. The number of columns in the table is dynamic and changes according to the number of indicators. You can choose 1 Symbol, 3 different timeframes, 6 Indicators and 4 Simple or Exponential Moving Averages, specify the type and length of moving averages. You can also set the lengths for each Indicator. Indicators: - RSI – MACD - DMI (+DI and -DI + and ADX) - CCI - MFI - Push - EMA Length 20 (length adjustable) - EMA Length 50 (length adjustable) EMA Length 100 (length adjustable) - EMA Length 200 (length adjustable)
This script shows the Dashboard in a Table. Table.new() is a new feature and released today! Big thanks to Pine Team for adding this great new feature!
This new feature changes the rules of the game! The script shows 3 different time period indicator values for the icon and changes the background color of each cell using the current and last values of the indicators for the icon. The background color is green if the current value is greater than the last value, red if it is less than the last value, and gray if it is equal. You can select the time periods and Indicators to be displayed. You can also change the position, font sizes, title and text colors of the relevant panel on the graphic. The number of columns in the table is dynamic and changes according to the number of indicators. You can choose 1 Symbol, 3 different timeframes, 6 Indicators and 4 Simple or Exponential Moving Averages, specify the type and length of moving averages. You can also set the lengths for each Indicator. Indicators: - RSI – MACD - DMI (+DI and -DI + and ADX) - CCI - MFI - Push - EMA Length 20 (length adjustable) - EMA Length 50 (length adjustable) EMA Length 100 (length adjustable) - EMA Length 200 (length adjustable)
보호된 스크립트입니다
이 스크립트는 비공개 소스로 게시됩니다. 하지만 이를 자유롭게 제한 없이 사용할 수 있습니다 – 자세한 내용은 여기에서 확인하세요.
면책사항
해당 정보와 게시물은 금융, 투자, 트레이딩 또는 기타 유형의 조언이나 권장 사항으로 간주되지 않으며, 트레이딩뷰에서 제공하거나 보증하는 것이 아닙니다. 자세한 내용은 이용 약관을 참조하세요.
면책사항
해당 정보와 게시물은 금융, 투자, 트레이딩 또는 기타 유형의 조언이나 권장 사항으로 간주되지 않으며, 트레이딩뷰에서 제공하거나 보증하는 것이 아닙니다. 자세한 내용은 이용 약관을 참조하세요.