OPEN-SOURCE SCRIPT
SMU STDEV Overlap Candles with Highest and Lowest
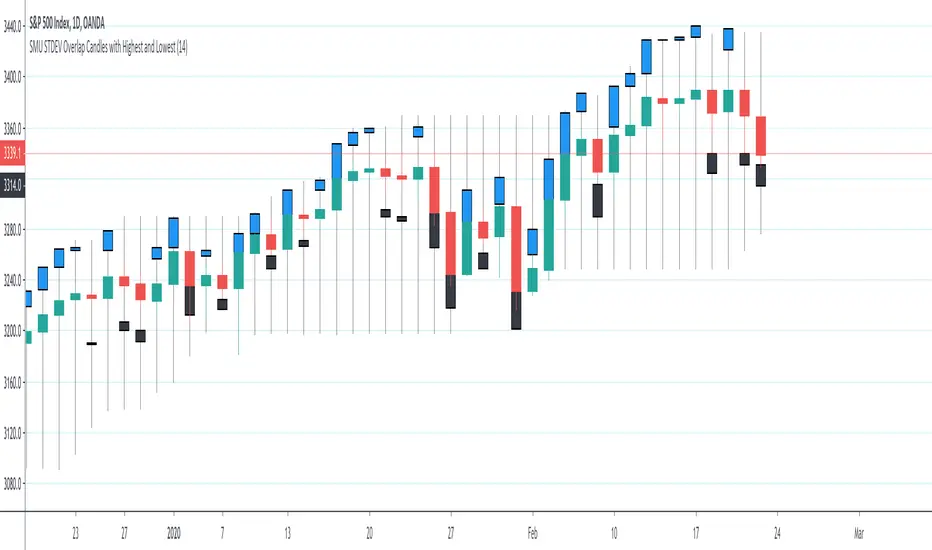
This script creates a STDEV in a candle format overlayed on the actual candles. The STDEV candles lead with deviation to upside or downside.
The Blue bars are Upside heads-up showing the strength of the uptrend before it happens.
The Black candles are downside indicators pulling on the price
I like price action because it is raw. So for High and Low I used the highest and lowest amount so when you trade you can see where the price is in relation to previous high and low
I use this script in conjunction with my first STDEV candles to get the full picture in short time frames. For example, when I see the STDEV of above 6 on change of direction then I trade on it before the trend begins and confirm it with STDEV overlay
If you have you been following my scripts you notice the code is very simple but the concept is very powerful. My hope is better pine script coders to build on these scripts and publish more out of the box type of scripts.
Enjoy
오픈 소스 스크립트
트레이딩뷰의 진정한 정신에 따라, 이 스크립트의 작성자는 이를 오픈소스로 공개하여 트레이더들이 기능을 검토하고 검증할 수 있도록 했습니다. 작성자에게 찬사를 보냅니다! 이 코드는 무료로 사용할 수 있지만, 코드를 재게시하는 경우 하우스 룰이 적용된다는 점을 기억하세요.
면책사항
해당 정보와 게시물은 금융, 투자, 트레이딩 또는 기타 유형의 조언이나 권장 사항으로 간주되지 않으며, 트레이딩뷰에서 제공하거나 보증하는 것이 아닙니다. 자세한 내용은 이용 약관을 참조하세요.
오픈 소스 스크립트
트레이딩뷰의 진정한 정신에 따라, 이 스크립트의 작성자는 이를 오픈소스로 공개하여 트레이더들이 기능을 검토하고 검증할 수 있도록 했습니다. 작성자에게 찬사를 보냅니다! 이 코드는 무료로 사용할 수 있지만, 코드를 재게시하는 경우 하우스 룰이 적용된다는 점을 기억하세요.
면책사항
해당 정보와 게시물은 금융, 투자, 트레이딩 또는 기타 유형의 조언이나 권장 사항으로 간주되지 않으며, 트레이딩뷰에서 제공하거나 보증하는 것이 아닙니다. 자세한 내용은 이용 약관을 참조하세요.